Download
1 / 21
220 likes | 413 Views
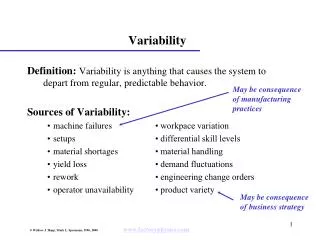
Variability. Variability. Variability How tightly clustered or how widely dispersed the values are in a data set. Example Data set 1: [0,25,50,75,100] Data set 2: [48,49,50,51,52] Both have a mean of 50, but data set 1 clearly has greater Variability than data set 2.

E N D
Variability • Variability • How tightly clustered or how widely dispersed the values are in a data set. • Example • Data set 1: [0,25,50,75,100] • Data set 2: [48,49,50,51,52] • Both have a mean of 50, but data set 1 clearly has greater Variability than data set 2.
Variability: The Range • The Range is one measure of variability • The range is the difference between the maximum and minimum values in a set • Example • Data set 1: [1,25,50,75,100]; R: 100-0 +1 = 100 • Data set 2: [48,49,50,51,52]; R: 52-48 + 1= 5 • The range ignores how data are distributed and only takes the extreme scores into account • RANGE = (Xlargest – Xsmallest) + 1
Quartiles • Split Ordered Data into 4 Quarters • = first quartile • = second quartile= Median • = third quartile 25% 25% 25% 25%
25% 75% Md Q1 Q3 Quartiles
Variability: Interquartile Range • Difference between third & first quartiles • Interquartile Range = Q3 - Q1 • Spread in middle 50% • Not affected by extreme values
Standard Deviation and Variance • How much do scores deviate from the mean? • deviation = • Why not just add these all up and take the mean? = 2
Standard Deviation and Variance • Solve the problem by squaring the deviations! = 2 Variance =
Standard Deviation and Variance • Higher value means greater variability around • Critical for inferential statistics! • But, not as useful as a purely descriptive statistic • hard to interpret “squared” scores! • Solution un-square the variance! Standard Deviation =
Variability: Standard Deviation • The Standard Deviation tells us approximately how far the scores vary from the mean on average • estimate of average deviation/distance from • small value means scores clustered close to • large value means scores spread farther from • Overall, most common and important measure • extremely useful as a descriptive statistic • extremely useful in inferential statistics The typical deviation in a given distribution
Variability: Standard Deviation • Standard Deviation can be calculated with the sum of squares (SS) divided by n
Sample variance and standard deviation • Sample will tend to have less variability than popl’n • if we use the population fomula, our sample statistic will be biased • will tend tounderestimate popl’n variance
Sample variance and standard deviation • Correct for problem by adjusting formula • Different symbol:s2 vs. 2 • Different denominator:n-1 vs. N • n-1 = “degrees of freedom” • Everything else is the same • Interpretation is the same
Definitional Formula: • deviation • squared-deviation • ‘Sum of Squares’ = SS • degrees of freedom Variance: Standard Deviation:
Variability: Standard Deviation • let X = [3, 4, 5 ,6, 7] • M = 5 • (X - M) = [-2, -1, 0, 1, 2] • subtract M from each number in X • (X - M)2 = [4, 1, 0, 1, 4] • squared deviations from the mean • S(X - M)2 = 10 • sum of squared deviations from the mean (SS) • S(X - M)2 /n-1 = 10/5 = 2.5 • average squared deviation from the mean • S(X - M)2 /n-1 = 2.5 = 1.58 • square root of averaged squared deviation
Variability: Standard Deviation • let X = [1, 3, 5, 7, 9] • M = 5 • (X - M) = [-4, -2, 0, 2, 4 ] • subtract M from each number in X • (X - M)2 = [16, 4, 0, 4, 16] • squared deviations from the mean • S(X - M)2 = 40 • sum of squared deviations from the mean (SS) • S(X - M)2 /n-1 = 40/4 = 10 • average squared deviation from the mean • S(X - M)2 /n-1 = 10 = 3.16 • square root of averaged squared deviation
In class example • Work on handout
Standard Deviation & Standard Scores • Z scores are expressed in the following way • Z scores express how far a particular score is from the mean in units of standard deviation
Standard Deviation & Standard Scores • Z scores provide a common scale to express deviations from a group mean
Standard Deviation and Standard Scores • Let’s say someone has an IQ of 145 and is 52 inches tall • IQ in a population has a mean of 100 and a standard deviation of 15 • Height in a population has a mean of 64” with a standard deviation of 4 • How many standard deviations is this person away from the average IQ? • How many standard deviations is this person away from the average height?
Homework • Chapter 4 • 8, 9, 11, 12, 16, 17