Download
1 / 78
780 likes | 908 Views
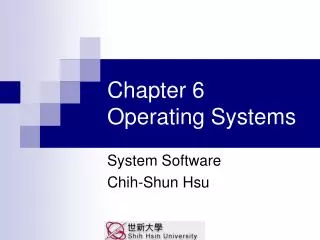
Chapter 8 I/O Systems. 5 Components of Any Computer. Keyboard , Mouse. Computer. Processor (active). Devices. Memory (passive) (where programs, data live when running). Disk (where programs, data live when not running). Input. Control (“brain”). Output. Datapath

E N D
5 Components of Any Computer Keyboard, Mouse Computer Processor (active) Devices Memory (passive) (where programs, data live when running) Disk(where programs, data live when not running) Input Control (“brain”) Output Datapath (“brawn”) Display, Printer
“What’s This Stuff Good For?” • Remote Diagnosis:“NeoRest ExII,” a high-tech toilet features microprocessor-controlled seat warmers, automatic lid openers, air deodorizers, water sprays and blow-dryers that do away with the need for toilet tissue... Toto's engineers are now working on a model that analyzes urine to determine blood-sugar levels in diabetics and then automatically sends a daily report, by modem, to the user's physician.One Digital Day, 1998 www.intel.com/onedigitalday
Motivation for Input/Output • I/O is how humans interact with computers • I/O gives computers long-term memory. • I/O lets computers do amazing things: • Read pressure of synthetic hand andcontrol synthetic arm and hand of fireman • Control propellers, fins, communicate in BOB (Breathable Observable Bubble) • Computer without I/O like a car without wheels; great technology, but won’t get you anywhere
I/O Design Issues • Many factors (expandability, resilience) besides perf. • I/O performance complex: latency, throughput • I/O performance depends on aspects of system: • Access latency, throughput, connection between devices and the system, memory hierarchy, OS
Outline • I/O performance measures • Types and characteristics of I/O devices • Buses • Interfacing I/O devices • Designing an I/O system
I/O System Performance • I/O System performance depends on many aspects of the system (limited by weakest link in the chain): • The CPU • The memory system: • Internal and external caches • Main memory • The underlying interconnection (buses) • The I/O controller • The I/O device • The speed of the I/O software (operating system) • The efficiency of the software’s use of the I/O devices • Two common performance metrics: • Throughput: I/O bandwidth • Response time: latency
Conflicting goals Simple Producer-Server Model • Throughput: • Number of tasks completed by the server in unit time • In order to get the highest possible throughput: • The server should never be idle • The queue should never be empty • Response time: • Begins when a task is placed in the queue and ends when it is completed by the server • In order to minimize the response time: • The queue should be empty and the server is idle Producer Queue Server
Throughput vs. Response Time Response Time (ms) pay a steep price in response time to get the last few % of max. throughput 300 200 100 20% 40% 60% 80% 100% Percentage of maximum throughput
Throughput Enhancement Server • In general throughput can be improved by: • Throwing more hardware at the problem • Response time is much harder to reduce: • Ultimately limited by speed of light (we are far from it) Queue Producer Queue Server
I/O Benchmarks for Perf. Measure (1/2) • Supercomputer application: • Large-scale scientific problems => large files • One large read and many small writes to snapshot computation • Concerned with data rate: MB/second between memory and disk • Transaction processing: • Examples: Airline reservations systems and bank ATMs • Small changes to large shared database • Concerned with I/O rate: number of disk accesses/second in bytes/second • Typical benchmark: TPC-C • light/medium-weight queries on order-entry
I/O Benchmarks for Perf. Measure (2/2) • File system: • Measurements of UNIX file systems in an engineering environment: • 80% of accesses are to files less than 10 KB • 90% of all file accesses are to data with sequential addresses on the disk • 67% are reads, 27% writes, 6% read-modify-write • A synthetic benchmark: 70 files of 200KB in 5 phases • MakeDir • Copy • ScanDir • ReadAll • Make
Outline • I/O performance measures • Types and characteristics of I/O devices • Buses • Interfacing I/O devices • Designing an I/O system
I/O Device Examples and Speeds • I/O Speed: bytes transferred per second(from mouse to display: 1-to-million) Device Behavior Partner Data Rate (KBytes/s) Keyboard Input Human 0.01 Mouse Input Human 0.02 Voice output Output Human 5.00 Floppy disk Storage Machine 50.00 Laser printer Output Human 100.00 Magnetic disk Storage Machine 10,000.00 Network-LAN I or O Machine 10,000.00 Graphics display Output Human 30,000.00 We will concentrate on disks in the following discussion
Disk History (1/2) Data density Mbit/sq. in. Capacity of Unit Shown Megabytes 1973: 1. 7 Mbit/sq. in 140 MBytes 1979: 7. 7 Mbit/sq. in 2,300 MBytes source: New York Times, 2/23/98, page C3, “Makers of disk drives crowd even more data into even smaller spaces”
Disk History (2/2) 1997: 3090 Mbit/sq. in 8100 MBytes 1989: 63 Mbit/sq. in 60,000 MBytes source: New York Times, 2/23/98, page C3, “Makers of disk drives crowd even more data into even smaller spaces”
1-inch Disk Drive! • 2000 IBM MicroDrive: • 1.7” x 1.4” x 0.2” • 1 GB, 3600 RPM, 5 MB/s, 15 ms seek • Digital camera, PalmPC? • 2006 MicroDrive? • 9 GB, 50 MB/s! • Assuming it finds a niche in a successful product • Assuming past trends continue
Storage Technology Drivers • Driven by the prevailing computing paradigm • 1950s: migration from batch to on-line processing • 1990s: migration to ubiquitous computing • computers in phones, books, cars, video cameras, … • nationwide fiber optical network with wireless tails • Effects on storage industry: • Embedded storage • smaller, cheaper, more reliable, lower power • Data utilities • high capacity, hierarchically managed storage • Network-attached storage (NAS)
Historical Perspective • Form factor and capacity drives market, more than performance • 1970s: Mainframes => 14 inch diameter disks • 1980s: Minicomputers, Servers => 8”, 5.25” diameter disks • Late 1980s/Early 1990s: • Pizzabox PCs => 3.5 inch diameter disks • Laptops, notebooks => 2.5 inch disks • Palmtops didn’t use disks, so 1.8 inch diameter disks didn’t make it
Technology Trends Disk Capacity now doubles every 18 mo; before 1990 every 36 months The I/O GAP • Today: processing power doubles every 18 months • Today: memory size doubles every 18 months (4X/3yr) • Today: disk capacity doubles every 18 months • Disk positioning rate (Seek + Rotate) doubles every ten years!
Inner Track Outer Track Sector Head Arm Platter Actuator Disk Device Technology • Several platters, with information recorded magnetically on both surfaces (usually) • Bits recorded in tracks, which in turn divided into sectors (e.g., 512 Bytes); error correction code per sector to find and correct errors • Actuator moves head (end of arm) over track (“seek”), wait for sector rotate under head, then read or write • “Cylinder”: all tracks under heads
{ Platters (12) Photo of Disk Head, Arm, Actuator Spindle Arm Head Actuator
Magnetic Disk Characteristic Track • Cylinder: all tacks under the head at a given point on all surface • Read/write is a 3-stage process: • Seek time: position the arm overproper track (8 to 20 ms. avg.) • Rotational latency: wait for desiredsector rotate under head (.5 / RPM) • Transfer time: transfer a block of bits (sector)under the read-write head (2 to 15 MB/sec) • Disk controller time • Average seek time in the range of 8 ms to 12 ms • (Sum of time for all possible seek) / (total # of possible seeks) • Due to locality of disk reference, actual average seek time may only be 25% to 33% of advertised number Sector Cylinder Platter Head
Typical Numbers of a Magnetic Disk • 1000 to 5,000 tracks per surface • 64 to 200 sectors per track (512 bytes/sector) • A sector is the smallest unit that can be read or written(sector #, gap, information of sector+CRC, gap, …) • Traditionally all tracks have same number of sectors: • Constant bit density: more sectors on outer tracks • Recently relaxed: constant bit size, speed varies with track location Diameter: 1.8” to 8” Platters(1-15) Track Sector
Typical Numbers of a Magnetic Disk Track • Rotational Latency: • Most disks rotate at 3,600 to 7200 RPM • Approximately 16 ms to 8 ms per revolution, respectively • An average latency to the desiredinformation is halfway around the disk: 8 ms at 3600 RPM, 4 ms at 7200 RPM • Transfer Time is a function of : • Transfer size (usually a sector): 1 KB / sector • Rotation speed: 3600 RPM to 10000 RPM • Recording density: bits per inch on a track • Diameter typical diameter ranges from 1.8 to 5.25 in • Typical values: 2 to 40 MB per second Sector Cylinder Platter Head
An Example:Barracuda 180 • 181.6 GB, 3.5-inch disk • 7200 RPM; SCSI 4.16 ms = 1/2 rotation • 12 platters, 24 surfaces • 31.2 Gbit/sq. in. areal density • 10 watts (idle) • 0.1 ms controller time • 8.0 ms avg. seek • 35 to 64 MB/s(internal) • $7.50 / GB • (Lower capacity, ATA/IDE disks ~ $2 / GB) source: www.seagate.com;
Disk Device Performance • Average distance of a sector from head? 1/2 time of a rotation • 7200 Revolutions Per Minute => 120 Rev/sec • 1 revolution = 1/120 sec => 8.33 milliseconds • 1/2 rotation (revolution) => 4.16 ms • Average number of tracks moved under arm? • Sum all possible seek distances / # possible • Assumes average seek distance is random Controller Disk Latency = Queueing Time + Controller time + Seek Time + Rotation Time + transfer Time
Example • 512 byte sector, rotate at 5400 RPM, advertised seeks is 12 ms, transfer rate is 4 MB/sec, controller overhead is 1 ms, queue idle so no service time Disk Access Time = Seek time + Rotational Latency + Transfer time + Controller Time + Queuing Delay Disk Access Time = 12 ms + 0.5 / 5400 RPM + 0.5 KB / 4 MB/s + 1 ms + 0 Disk Access Time = 12 ms + 0.5 / 90 RPS + 0.125 / 1024 s + 1 ms + 0 Disk Access Time = 12 ms + 5.5 ms + 0.1 ms + 1 ms + 0 ms Disk Access Time = 18.6 ms • If real seeks are 1/3 advertised seeks, then its 10.6 ms, with rotation delay at 50% of the time!
Areal Density • Bits recorded along a track • Metric is Bits Per Inch (BPI) • Number of tracks per surface • Metric is Tracks Per Inch (TPI) • Care about bit density per unit area • Metric is Bits Per Square Inch • Called Areal Density • Areal Density = BPI x TPI
Data Rate: Inner vs. Outer Tracks • To keep things simple, originally kept same number of sectors per track • Since outer track longer, lower bits per inch • Competition decided to keep BPI the same for all tracks (“constant bit density”) • More capacity per disk • More of sectors per track towards edge • Since disk spins at constant speed, outer tracks have faster data rate • Bandwidth outer track 1.7X inner track!
Disk Performance Model/Trends • Capacity + 100%/year (2X / 1.0 yrs) • Transfer rate (BW) + 40%/year (2X / 2.0 yrs) • Rotation + Seek time – 8%/ year (1/2 in 10 yrs) • MB/$ > 100%/year (2X / <1.5 yrs) Fewer chips + areal density • Areal density Change slope 30%/yr to 60%/yr about 1991
Reliability and Availability • Two terms that are often confused: • Reliability: Is anything broken? • Availability: Is the system still available to the user? • Availability can be improved by adding hardware: • Example: adding ECC on memory • Reliability can only be improved by: • Better environmental conditions • Building more reliable components • Building with fewer components • Improve availability may come at the cost of lower reliability
Disk Arrays • Arrays of small and inexpensive disks • Increase potential throughput with many disk drives: • Data is spread over multiple disk • Multiple accesses are made to several disks • Reliability is lower than a single disk: • But availability improved with redundant disks (RAID): • Lost information reconstructed from redundant infor.
Disk Summary • Magnetic Disks continue rapid advance: 60%/yr capacity, 40%/yr bandwidth, slow on seek, rotation improvements, MB/$ improving 100%/yr? • Designs to fit high volume form factor • Disk performance:Disk Latency = Queuing Time + Controller time + Seek Time + Rotation Time + transfer Time • RAID • Higher performance with more disk arms per $ • Adds availability option for small number of extra disks
Outline • I/O performance measures • Types and characteristics of I/O devices • Buses • Interfacing I/O devices • Designing an I/O system
Processor Input Control Memory Datapath Output What Is a Bus? • A Bus Is: • shared communication link • single set of wires used to connect multiple subsystems • A Bus is also a fundamental tool for composing large, complex systems • systematic means of abstraction
Ex.: Pentium System Organization Processor/Memory Bus PCI Bus I/O Busses
Advantages of Buses • Versatility: • New devices can be added easily • Peripherals can be moved between computersystems that use the same bus standard • Low Cost: • A single set of wires is shared in multiple ways I/O Device I/O Device I/O Device Memory Processor
Disadvantage of Buses • It creates a communication bottleneck • Bus bandwidth can limit the maximum I/O throughput • The maximum bus speed is largely limited by: • The length of the bus • The number of devices on the bus • The need to support a range of devices with: • Widely varying latencies • Widely varying data transfer rates I/O Device I/O Device I/O Device Memory Processor
The General Organization of a Bus • Control lines: • Signal requests and acknowledgments • Indicate what type of information is on the data lines • Address/Data lines carry information between the source and the destination: • Data and addresses may be shared in a multiplexed way • Complex commands Control Lines Address Lines Data Lines
Terminology • A bus transaction includes two parts: • Issuing the command (and address) request • Transferring the data action, response • These are often preceded by arbitration • Master is the one who starts the bus transaction by: • issuing the command (and address) • Slave is the one who responds to the address by: • Sending data to the master if the master ask for data • Receiving data from the master if the master wants to send data Master issues command Bus Master Bus Slave Data can go either way
Buses According to Functionality • Processor-Memory Bus (design specific) • Short and high speed • Need to match memory system to maximize memory-to-processor bandwidth, e.g., for cache block transfers • Connects directly to the processor • Optimized for cache block transfers • I/O Bus (industry standard, e.g., SCSI) • Usually is lengthy and slower • Need to match a wide range of I/O devices • Connects to processor-memory bus or backplane bus • Backplane Bus (standard or proprietary, e.g., PCI) • Backplane: an interconnection structure in the chassis, to allow processors, memory, and I/O devices to coexist • Cost advantage: one bus for all components
A Computer System with One Bus: Backplane Bus • A single bus (the backplane bus) is used for: • Processor to memory communication • Communication between I/O devices and memory • Advantages: Simple and low cost • Disadvantages: slow and the bus can become a major bottleneck • Example: IBM PC-AT Backplane Bus Processor Memory I/O Devices
A Two-Bus System • I/O buses tap into processor-memory bus via bus adapters: • Processor-memory bus: for processor-memory traffic • I/O buses: provide expansion slots for I/O devices • Apple Macintosh-II • NuBus: Processor, memory, a few selected I/O devices • SCCI Bus: the rest of the I/O devices Processor Memory Bus Processor Memory Bus Adapter Bus Adapter Bus Adapter I/O Bus I/O Bus I/O Bus
Bus Adapter Bus Adapter A Three-Bus System • A small number of backplane buses tap into the processor-memory bus • Processor-memory bus for processor-memory traffic • I/O buses are connected to the backplane bus • Advantage: loading on processor bus is reduced Processor Memory Bus Processor Memory Bus Adapter I/O Bus Backplane Bus I/O Bus
Main Components of Intel Chipset • Northbridge: • Handles memory • Graphics • Southbridge: I/O • PCI bus • Disk controllers • USB controllers • Audio • Serial I/O • Interruptcontroller • Timers
Buses According to Clocking • Synchronous Bus: • Includes a clock in the control lines • A fixed protocol for communication relative to clock • Advantage: very little logic and can run very fast • Disadvantages: • Every device on the bus must run at the same clock rate • To avoid clock skew, they cannot be long if they are fast • Asynchronous Bus: • It is not clocked • It can accommodate a wide range of devices • It can be lengthened without worrying about clock skew • It requires a handshaking protocol
Simple Synchronous Protocol • All devices operate synchronously and all can source/sink data at same rate • Even memory busses are more complex than this • memory (slave) may take time to respond • it needs to control data rate Bus Req Bus Grant R/W Address Cmd+Addr Data1 Data2 Data
Simple Synchronous Protocol • Slave indicates when it is prepared for data transfer • Actual transfer goes at bus rate Bus Req Bus Grant R/W Address Cmd+Addr First write failed Wait Data Data1 Data1 Data2
Asynchronous Handshake (Read) t0 : Master obtains control and asserts address, direction, data; waits a specified amount of time for slaves to decode target t1: Master asserts request line t2: Slave asserts ack, indicating ready to transmit data t3: Master releases req, data received t4: Slave releases ack Address Data Read Req Ack Master Asserts Address Next Address Slave Asserts Data t0 t1 t2 t3 t4 t5