Download
1 / 22
220 likes | 223 Views
TESTING THE ASSUMPTIONS OF VARIABLES CONTROL CHARTS AND AN APPLICATION ON FOOD INDUSTRY. Berna YAZICI Department of Statistics, Anadolu University Eskisehir,Turkey E-mail:bbaloglu@anadolu.edu.tr. ABSTRACT.

E N D
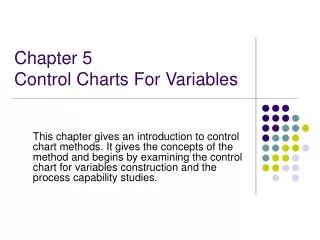
TESTING THE ASSUMPTIONS OF VARIABLES CONTROL CHARTS AND AN APPLICATION ON FOOD INDUSTRY Berna YAZICI Department of Statistics, Anadolu University Eskisehir,Turkey E-mail:bbaloglu@anadolu.edu.tr
ABSTRACT In this study the statistical assumptions to construct variables quality control charts have been held. Testing those assumptions are mentioned and the solutions for the researcher, in case of violation of the assumptions are also explained.
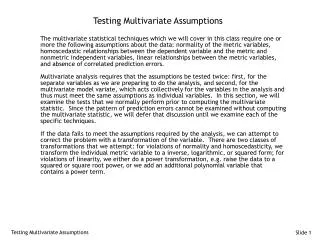
INTRODUCTION Quality is generally desirable characteristics of a product or service should have. The customers have many options to select a product or service. So companies need improve the quality of they produce to survive. Quality improvement is the reduction of variability in processes and products. Variability is described by statistical methods. Control charts are one of the tools that is used to detect whether the process is under control or not. But those charts may cause misunderstandings if the researchers make decisions in case of violation some assumptions. These assumptions are uncorrelated measurements, normality, homoscedasticity and homogeneity of means.
INTRODUCTION For application, 144 measurements are taken from a factory that produces wafers. The thickness of wafers is in question for statistical process control studies in this company. For the study 16 samples, with 9 measurements each, are used. All samples are taken by the same worker half an hour periodically. Each of the assumptions mentioned above has been tested on this data set. Recommendations in case of violation of each assumption are mentioned.
1. UNCORRELATED MEASUREMENTS ASSUMPTION All the samples selected randomly are independent of the one immediately preceding and the one immediately following, briefly independency of the measurements. å + + + - ( X X X X ... X X ) X X + + 1 L 1 2 L 2 n L • In Eq. L is the amount of lag. r = L n å å 2 - X X X - • In runs test, duration of completed runs (d) is important. The expected number of completed runs of deviations is and the expected number of completed runs of all durations is n 3 ˆ å = E ( f ) 2 - - n d 1 ˆ = f + d 1 2
= r 0 . 54 1 16 2 2 c c calc table FOR THE DATA SET OF WAFER THICKNESS • Lower point: –0.462 upper point is 0.328. The result is not between the confidence interval limits • Runs test • = 45.71> =2.167 We reject the null hypothesis of uncorrelated measurements
1. UNCORRELATED MEASUREMENTS ASSUMPTION If the assumption is violated • In this case researcher may fit an ARIMA model and apply standard control charts to residuals instead of the raw data. Residuals will give uncorrelated results. • Exponentially weighted moving average (EWMA) control charts can be used by moving centerline, with control limits based on prediction error variance. • To decide whether or not an autocorrelated process may be considered in control, one must investigate the reasons for the autocorrelation. After that, it will be easier to eliminate the autocorrelation by using an engineering controller. In this case, the reason of the autocorrelation can be determined and uncorrelated measurements can be held. • One way to remove autocorrelation is taking the samples in larger sampling intervals if the process structure is suitable. In this way, Shewhart control charts become appropriate.
2. NORMALITY ASSUMPTION The distribution of means will be normalif the population is normally distributed. • 2 test of goodness of fit • Shapiro-Wilk’s W test for normality • where bi is calculated as followsmi representing the expected valuesof the order statistics from a unit normal distribution 2 ì ü n ï ï å ¢ ( b X ) í ý i i ï ï î þ = i 1 ¢ = W 2 å - ( X X ) i m i = b i n 2 å m i = i 1 • Graphical methods that the researcher can apply using computer packages for testing the normality, such as Q-Q Plot, Lilliefors Test
2 2 c c calc table FOR THE DATA SET OF WAFER THICKNESS • = 0.959< =1.635 • Shapiro-Wilk’s W test for normality • Wcal=0.9694 critical value for =0.05 and 16 from table is 0.887. • Wcal>W(16; 0.05) We cannot reject the hypothesis of normality.
2. NORMALITY ASSUMPTION If the assumption is violated • The Camp-Meidell adjustment for normality can be made • According to Tchebycheff inequality, no matter the • shapeof the distribution • If the population is not too skewed and unimodal larger sample sizes suffice the normality assumption due to central limit theorem • The development of X-bar, R and S chart mechanics is based on the process metric being normally distributed. However, the chart itself is robust to deviations from normality depending on the central limit theorem 100 - 100 2 2 . 25 z 100 - 100 2 z
m å 2 2 = - - - M ( N m ) ln s ( n 1 ) ln s p i i = i 1 3. HOMOGENEITY OF VARIANCES The variances within each of the samples must be equal 2 l arg ests • One way to test homogeneity of variances is Cochran’s g test = g 2 sum of s • 1 test 2 2 2 2 s + + + ( s s ... s ) / m m T • 0 test 1 2 L = L = 0 1 2 2 2 1 / m 2 2 2 1 / m ( s s ... s ) ( s s ... s ) m m 1 2 1 2 M • Bartlett’s test 2 c = c m é ù æ ö 2 m å - 1 1 1 ( n 1 ) s ç ÷ å i = + ê - ú i c 1 ç ÷ = - - - 2 i 1 3 ( m 1 ) n 1 N m ê ú = s è ø i = ë û i 1 p - N m
2 2 c c table calc FOR THE DATA SET OF WAFER THICKNESS • 0=1.727>table=1.41 • 1=1.31 >table=1.23 • Bartlett’s test • = 59.846> We reject the null hypothesis of equal variances.
3. HOMOGENEITY OF VARIANCES If the assumption is violated • Taking new samples with equal number of observations may be the best solution
4. HOMOGENEITY OF MEANS The control charts are constructed with the homogeny samples from a process 2 s • 0 test T L = 0 2 2 2 1 / m ( s s ... s ) m 1 2 • ANOVA test • Before constructing an ANOVA test, one must be sure whether there are extraordinary sample mean or not 2 - X X s + 1 i 1 B = r = F ij - X X 2 - n j 1 s w
FOR THE DATA SET OF WAFER THICKNESS • Critical value from Dixon’s table is 0.507>0.15 We cannot reject the H0 hypothesis and we conclude that there are not any extraordinary sample mean among 16 sample means. • Fcal = 2.566>F0.05;15;128=2.11 We conclude that the means are not homogenous
4. HOMOGENEITY OF MEANS If the assumption is violated • One can select new samples by equal time intervals The methods described here are summarized by a flow chart on next four slides
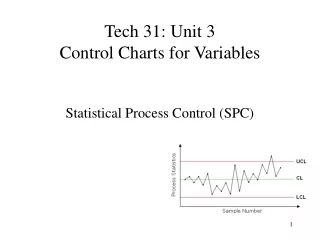
Test uncorrelated measurements assumption Use a test depending on the circular autocorrelation coefficient Use runs test Assumption satisfied Yes No Fit ARIMA model Use EWMA control charts Research the reason of autocorrelation Take samples in larger sample intervals Test the normality assumption
Test the normality assumption Use 2test Use Shopiro-Wilk’s W test Use Graphical methots Assumption satisfied Yes No Use Camp-Meidell adjustment Use Tchebycheff inequality Take larger samples Only use X-bar charts Test homogeneity of variances assumption
Test homogeneity of variances assumption Use Cochran’s gtest Use0 test Use1 test Use Bartlett’s test Assumption satisfied Yes No Take new samples with equal numbers of observations Test homogeneity of means assumption
Test homogeneity of means assumption Use ANOVA test Assumption satisfied Yes No Take new samples by equal time intervals Construct the control charts
CONCLUSIONS AND RECOMMENDATIONS In statistical process control studies, variables control charts are one of the best guide for the researcher to detect the changes in the process. Before constructing those charts firstly some assumptions must be tested. The assumptions in question are uncorrelated measurements, normality, homogeneity of variances and homogeneity of means. To avoid the misunderstandings and wrong interpretations of these charts, one should test those assumptions and if the assumptions are satisfied, then the charts must be constructed.
5.REFERENCES [1] Montgomery D., Introduction to Statistical Quality Control, Third Edition, John Wiley & Sons. Inc., 1996. [2] Farnum N. R., Modern Statistical Quality Control and Improvement, Duxbury Press, 1994. [3] Cowden J. D., Statistical Methods in Quality Control, Prentice-Hall Inc., 1957. [4] Şentürk S., Niceliksel Kalite Kontrol Grafiklerinin Varsayimlarinin Sinanmasi ve Bir Uygulama, Master of Science Thesis, Graduate School of Natural and Applied Sciences, Statistics Program, Anadolu University, 2002. [5] Kolarik W. J., Creating Qulity Process Design for Results, McGraw-Hill, 1999. [6] Kolarik W. J., Creating Quality Concepts, Systems, Strategies and Tools, McGraw-Hill, 1995. [7] Sahai H. and Ageel M., The Analysis of Variance: Fixed Random and Mixed Models, Boston: Birkhauser, 2000. [8] Hansen L. B., Quality Control: Theory and Applications, Prentice-Hall Inc., 1963. [9] DeVor R. E., Chang T. and Sutherland J. W., Statistical Quality Design and Control; Contemporary Concepts and Methods, Prentice-Hall Inc., 1992. [10] Summers D. C. S., Quality, Prentice-Hall Inc., 1997.