Download
1 / 14
140 likes | 363 Views
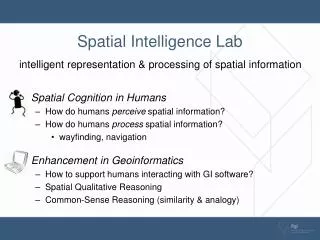
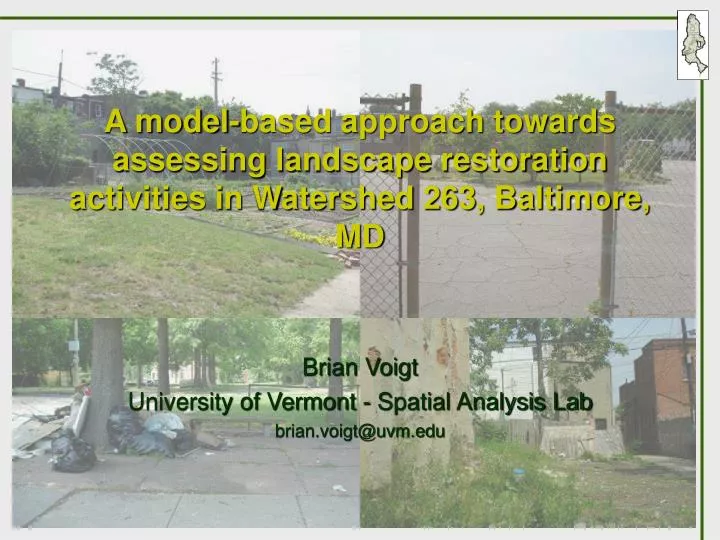
A model-based approach towards assessing landscape restoration activities in Watershed 263, Baltimore, MD. Brian Voigt University of Vermont - Spatial Analysis Lab brian.voigt@uvm.edu. Current Research - UrbanSim. Modeling urban development patterns in Chittenden County, VT using UrbanSim

E N D
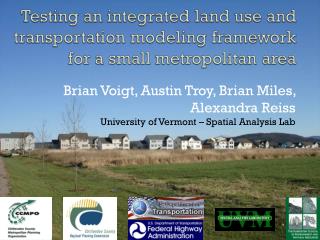
A model-based approach towards assessing landscape restoration activities in Watershed 263, Baltimore, MD Brian Voigt University of Vermont - Spatial Analysis Lab brian.voigt@uvm.edu
Current Research - UrbanSim • Modeling urban development patterns in Chittenden County, VT using UrbanSim • simulate future land use and associated environmental impacts under baseline conditions and alternative scenarios • Quantifying effect(s) of future urban development patterns have on: • water quality, habitat fragmentation, aesthetics, auto-dependency, energy consumption, etc. • Intended to facilitate discourse not predict policy adoption or exact development locations
Project Collaborators • Austin Troy, University of Vermont • Morgan Grove, USFS • Guy Hager & George Friday, Parks and People Foundation • Bill Stack, Department of Public Works • Others • Watershed council, community residents, BES collaborators
Research Questions • How do we design a simulation modeling framework to facilitate learning about future landscape trajectories based on human interventions and watershed restoration activities? • How will social and environmental conditions within Watershed 263 change as the City of Baltimore and the Parks and People Foundation strive to meet the urban forestry initiative goals?
Project Goals • Use a participatory modeling approach to explore relationships among socio-economic and biophysical system characteristics of a complex natural – human urban system • Help residents and resource managers to consider the effects of human interventions associated with varying levels of green infrastructure investment • Facilitate a learning process about the natural, biological and socio-economic components of the watershed and their collective interactions that define the current state and potential trajectories of watershed evolution
The Simile Modeling Environment • Dynamic, spatially explicit, interactions & feedback • Stocks, flows & parameters • Visual modeling environment • Sub-models can be used independently or grouped with other system components • Use equation editor to formalize variable relationships and sub-model interactions
WS263 Model Framework • Suite of sub-models that interact with one another • Partition landscape into set of grid cells and define initial condition based on biophysical and socio-economic parameters • Agent-based approach representing household level decision-making (e.g. relocation, rent v own, etc.) • Scenario-based analysis to improve our understanding of the system and accommodate variations in data interpretation and relative effects of system components
Data Sources • Demographics • US Census: Public-Use Microdata Samples (5% sample), Summary File data tables (SF1 & SF3) • BNIA: neighborhood indicators • Biophysical • BES: land cover, topography, water quality, air quality • Socio-economic • BNIA: employment and population control totals, forecasts • BES: employment sites, real estate transaction data, current land use / land use history, household surveys, PRISM classification • Infrastructure • Sewer system, road network, transit • Landscape interventions • PPF & DPW: list of completed, proposed, anticipated projects
Proposed Model Components: 1 • Land use: probability of transition from one type to another • Land cover: changes with interventions, aging vegetation, infrastructure addition / removal; relationship to water quality and other ecosystem services • Land price: defined by a hedonic model at the cell level • Employment: allocate employment at the cell level based on externally derived control totals using a gravity model • Residential location choice: internal and external; agents (households) synthesized from US Census, PUMS, and household survey data with a focus on tenure, length of residency, employment and income; includes QOL attributes
Proposed Model Components: 2 • Intervention: location choice; probability of success; exogenous inputs define number and type of projects; multiple sub-models for different types of interventions • Landscape metrics – land use mix, proximity to amenities / disamentities, fragmentation, residential and employment densities; updated annually, these metrics will be used as variables in the other model components; statistical analysis and existing literature will estimate relationships between metrics and system components • Mechanism to integrate external models (e.g. UFORE, etc.)
Model Output • Preliminary list of indicators • land value, canopy cover, habitat fragmentation, residential relocation and vacancy rates, QOL, green infrastructure density and water quality • refine list of indicators based on further collaboration with PPF and watershed council representatives • Data visualization • results depicted graphically as maps, overlaid with major streets and cultural landmarks, by joining the output to polygons bounded at alternative geographic scales (e.g., block group, neighborhood, etc.) • convey findings and engage stakeholder discussions
Expected Products • Fully documented model • Detail assumptions, limitations, and future improvements • Transferable to other urban sites • Sub-models can be “recycled” for other applications • Scenario analysis capability • Foster discussion among stakeholders • Useful for evaluating our knowledge of system components and understanding of system interactions • Algorithms for computing indicators
Next Steps • Explore relationships among diverse collection of data from multiple sources • Define base year condition • Create synthetic population at the household level • Conceptual model development (early 2007) • Work with project collaborators to identify appropriate indicators and techniques for conveying information / results to diverse stakeholder groups