Download
1 / 21
210 likes | 212 Views
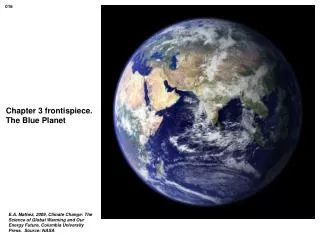
Understand the global coal consumption, emissions of CO2 from fossil fuel burning, and the potential for CO2 capture. Compare the performance and cost of coal-fired electricity generating technologies. Explore alternative energy sources like wind and solar power.

E N D
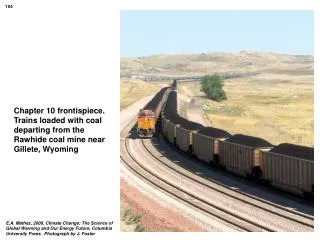
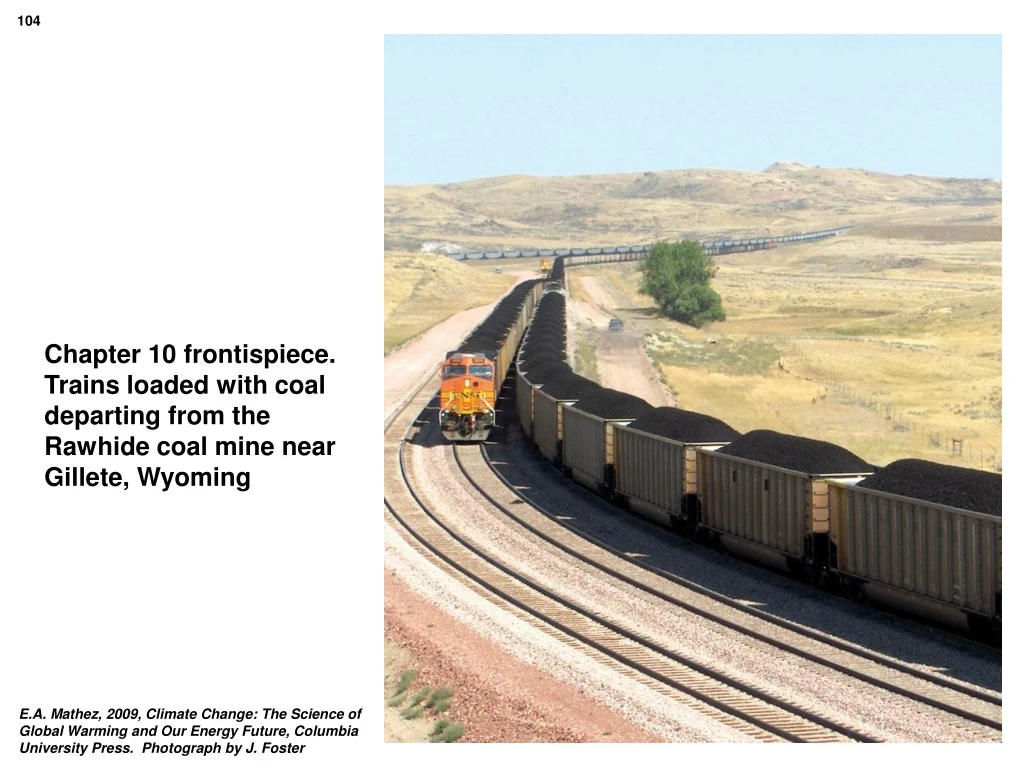
104 Chapter 10 frontispiece. Trains loaded with coal departing from the Rawhide coal mine near Gillete, Wyoming E.A. Mathez, 2009, Climate Change: The Science of Global Warming and Our Energy Future, Columbia University Press. Photograph by J. Foster
105 Figure 10.1. The fuels used to produce all energy worldwide, 2005 E.A. Mathez, 2009, Climate Change: The Science of Global Warming and Our Energy Future, Columbia University Press. Data from Energy Information Agency, DOE
Prefixes Kilo (K) 103 Giga (G) 109 Peta (P) 1015 Mega (M) 106 Tera (T) 1012 Exa (E) 1018 Units and Some Common Amounts Joule (J) = basic unit of energy exajoule = 1018 joules British thermal unit (Btu) = energy needed to heat 1 pound of water 1°F = 1,055 joules 1.055 exajoule = 1015 (1 quadrillion [quad]) Btu Toe = tons of oil equivalent = 41.868 x 10⁹ joules 1 million toe = 41.868 petajoule Watt (W) = unit of power (work) = energy per unit time = 1 joule/sec kilowatt = 1,000 watts, megawatt = 106 watts, gigawatt = 109 watts Watt hours (WH) = energy = 1 W delivered over 1 hour = 1 joules/sec x 3,600 sec/hr = 3,600 joules 1 kilowatt hour = 3.6 x 10⁶ joules, 1 megawatt hour = 3.6 x 10⁹ joules, 1 gigawatt hour = 3.6 x 10¹² joules, 1 kilowatt hour = 3,413 Btu Metric ton (t) = 1,000 kilograms 106 Table 10.1. Some common units of energy and power E.A. Mathez, 2009, Climate Change: The Science of Global Warming and Our Energy Future, Columbia University Press.
107 Figure 10.2. Emissions of CO2 from fossil-fuel burning according to fuel type, 2000-2005 and projected to 2030 E.A. Mathez, 2009, Climate Change: The Science of Global Warming and Our Energy Future, Columbia University Press. Data from Energy Information Agency, DOE
108 Figure 10.3. Annual emissions of CO2 from various sectors E.A. Mathez, 2009, Climate Change: The Science of Global Warming and Our Energy Future, Columbia University Press. Source: Rogner et al., 2007
United States 112.2 100.1 30.4 250.9 Russia 49.1 97.4 10.4 157.0 China 62.2 33.7 18.6 114.5 India 90.1 0.0 2.4 92.4 Non-OECDb Europe, Eurasia 45.4 17.0 28.4 90.8 Australia, New Zealand 38.6 2.4 38.0 79.1 South Africa 47.2 0.2 0.0 47.3 OECD Europe 17.7 4.5 17.1 39.3 Brazil 0.0 10.1 0.0 11.1 World total 479.7 270.4 155.0 905.1 aAnthracite, bituminous, and lignite are different coal types with decreasing carbon and heat contents bOECD = Organization for Economic Cooperation and Development. Bituminous and Anthracitea Sub- bituminous Region/Country Lignite Total 109 Table 10.2. World’s recoverable coal reserves in gigatons as of January 2003 E.A. Mathez, 2009, Climate Change: The Science of Global Warming and Our Energy Future, Columbia University Press. Source: Energy Information Agency, DOE
110 Figure 10.4. Current and projected coal consumption in India, the United States, China, and the rest of the world E.A. Mathez, 2009, Climate Change: The Science of Global Warming and Our Energy Future, Columbia University Press. Source: Energy Information Agency DOE
CO2 capture? No Yes No Yes No Yes No Yes Yes No Yes Efficiency (%) 34.3 25.1 38.5 29.3 43.3 34.1 34.8 25.5 30.6 38.4 31.2 CO2 emitteda 931 127 830 109 738 94 1,030 141 104 832 102 Costb 4.84 8.16 4.78 7.69 4.69 7.34 4.68 7.79 6.98 5.13 6.52 aIn units of grams per kilowatt hour. bCost of electricity (COE) in cents per kilowatt hour. The COE is the constant dollar electricity price required over the life of the plant to provide for all expenses and debt and bring in an acceptable rate of return to investors. Subcritical Pulverized Coal (PC) Super- Critical PC Ultra- Super- Critical PC Subcritical Circulating Fluid Bed Sub- critical PC-oxy Integrated Gas Combined Cycle (IGCC) 111 Table 10.3. Comparison of performance and cost of some coal-fired, electricity-generating technologies E.A. Mathez, 2009, Climate Change: The Science of Global Warming and Our Energy Future, Columbia University Press. Source: MIT
112 Figure 10.5. Simulation of the shape of a CO2 plume as it spreads through a porous layer over a 20-year period E.A. Mathez, 2009, Climate Change: The Science of Global Warming and Our Energy Future, Columbia University Press. Source: Doughty and Pruess, 2004
113 Figure 10.6. Schematic cross section and location of the Sleipner Project, Norwegian North Sea E.A. Mathez, 2009, Climate Change: The Science of Global Warming and Our Energy Future, Columbia University Press. Source: Benson et al., 2005
114 Uranium-235 fission (example reaction) uranium-235 + slow neutron barium-144 + krypton-90 + 2 neutrons + 200 megavolts E.A. Mathez, 2009, Climate Change: The Science of Global Warming and Our Energy Future, Columbia University Press. p. 198
115 Figure 10.7. Metatorbernite E.A. Mathez, 2009, Climate Change: The Science of Global Warming and Our Energy Future, Columbia University Press. Photograph by J. Newman, American Museum of Natural History
116 Table 10.4. Generating costs of wind and solar power in 2007 for three different amounts of sunlight received and wind velocities Received irradiance (watts per square meter per year) 1,700 2,000 2,300 Solar photovoltaic (cents per kilowatt hour) 29 25 21 Solar thermal (cents per kilowatt hour) 26 22 19 Wind velocity (meters per second at 50 meters above ground) 7.0-7.5 7.5-8.0 8.0-8.8 On-shore turbines (cents per kilowatt hour) 4.6 3.8 3.4 Off-shore turbines (cents per kilowatt hour) 5.3 4.5 E.A. Mathez, 2009, Climate Change: The Science of Global Warming and Our Energy Future, Columbia University Press. Source: Edmonds et al., 2007
117 Figure 10.8. Renewable sources of power as proportions of total U.S. electric net summer capacity, 2006 E.A. Mathez, 2009, Climate Change: The Science of Global Warming and Our Energy Future, Columbia University Press. Source: Energy Information Agency, DOE
118 Figure 10.9. Wind farm E.A. Mathez, 2009, Climate Change: The Science of Global Warming and Our Energy Future, Columbia University Press. Source: National Renewable Energy Laboratory, DOE
119 Figure 10.10. The growth of global installed wind power capacity, 1996-2007 E.A. Mathez, 2009, Climate Change: The Science of Global Warming and Our Energy Future, Columbia University Press.
Germany 22,247 23.6 7.0 United States 16,818 17.9 1.2a Spain 15,145 16.1 11.8 India 8,000 8.5 4.0b China 6,050 6.4 6.4 Denmark 3,125 3.3 21.2 Italy 2,726 2.9 1.7 France 2,454 2.6 1.2 United Kingdom 2,389 2.5 1.8 Portugal 2,150 2.3 9.3 Canada 1,846 2.0 1.1b Netherlands 1,746 1.9 3.4 Japan 1,538 1.6 0.5b Total Europe 57,136 60.7 3.8 World total 94,123 100.0 1.8b Note: Data are for countries with capacities greater than 1,000 megawatts. aFor 2006;bAs a proportion of total national electricity generation. Capacity (Megawatts) Percentage of World Capacity Percentage of National Electricity Demand 120 Table 10.5. National installed wind power capacities as of the end of 2007 E.A. Mathez, 2009, Climate Change: The Science of Global Warming and Our Energy Future, Columbia University Press. Source: Global Wind Energy Council
121 Figure 10.11. An array of photovoltaic panels E.A. Mathez, 2009, Climate Change: The Science of Global Warming and Our Energy Future, Columbia University Press. National Renewable Energy Laboratory, DOE, photograph by S. Wilcox
122 Figure 10.12. Parabolic troughs E.A. Mathez, 2009, Climate Change: The Science of Global Warming and Our Energy Future, Columbia University Press. National Renewable Energy Laboratory, DOE, photograph by W. Gretz
123 Figure 10.13. The worldwide growth of capacity from photovoltaic cells E.A. Mathez, 2009, Climate Change: The Science of Global Warming and Our Energy Future, Columbia University Press. Data from British Petroleum 2007
124 Figure 10.14. The stabilization triangle and wedge: a way of thinking about how to solve the emissions problem E.A. Mathez, 2009, Climate Change: The Science of Global Warming and Our Energy Future, Columbia University Press.