Download
1 / 27

E N D
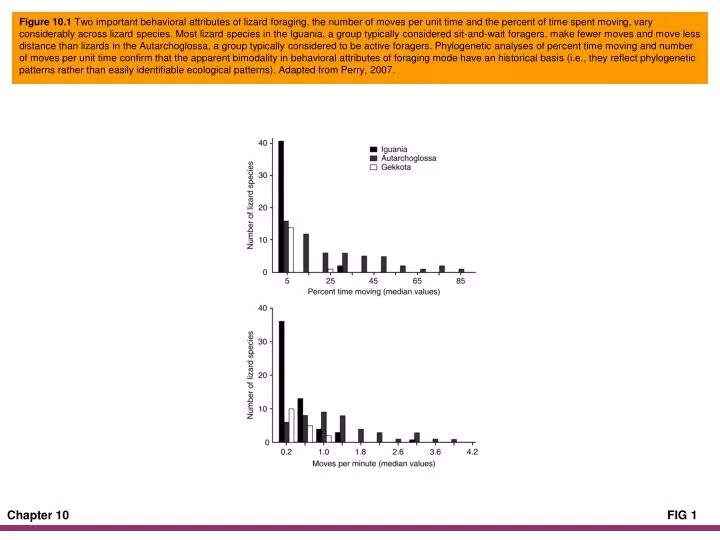
Figure 10.1 Two important behavioral attributes of lizard foraging, the number of moves per unit time and the percent of time spent moving, vary considerably across lizard species. Most lizard species in the Iguania, a group typically considered sit-and-wait foragers, make fewer moves and move less distance than lizards in the Autarchoglossa, a group typically considered to be active foragers. Phylogenetic analyses of percent time moving and number of moves per unit time confirm that the apparent bimodality in behavioral attributes of foraging mode have an historical basis (i.e., they reflect phylogenetic patterns rather than easily identifiable ecological patterns). Adapted from Perry, 2007.
Figure 10.2 Diets of amphibians and reptiles are influenced by a variety of abiotic and biotic factors. In addition, the evolutionary history of each species determines a portion of prey preferences. Adapted from Vitt and Pianka, 2007.
Figure 10.3 The eyes of chameleons, such as this Furcifer pardalis, move independently until a prey item is sighted. Photograph by Chris Mattison.
Figure 10.4 Elliptical pupils are found in some nocturnal frogs, lizards, and snakes, and in all crocodylians. The pupils, closed here, open in low light to facilitate vision at night. Clockwise from upper left: Hemidactylus mabouia, Corallus hortulanus, Osteocephalus taurinus, and Scaphiopus hurterii. Photographs by L. J. Vitt and J. P. Caldwell.
Figure 10.5 The long, flexible tongue of Xenoxybelis argenteus picks up particles from the air, surfaces, and potential prey. The odors are transmitted to the vomeronasal organs and allow identification and discrimination. The same sensing system is used in chemosensory-based social communication.Photograph by J. P. Caldwell.
Figure 10.6 The evolution of prey chemical discrimination and foraging mode appears linked in squamates. Several evolutionary reversals have occurred within major clades, four of which are shown here (Eublepharinae, Acanthodactylus scutellatus, Mabuya acutilabris, and Cordylinae). In instances where reversals have occurred, chemical cues are not used for prey discrimination, even though the sensing systems are developed. Clade names have been modified to maintain consistency with those in Chapter 20. Adapted from Cooper, 2007.
Figure 10.7 Facial heat-sensing pits between the nares and the eye on Bothrops moojeni and along the jaw of Corallus hortulanus allow these snakes to detect moving prey on the basis of their thermal image. Photographs by L. J. Vitt.
Figure 10.8 The alligator snapping turtle, Macrochelys temminckii, lures fish into its mouth by waving its fleshy tongue. The cryptic morphology of the nonmoving turtle combined with the resemblance of the tongue to a small earthworm facilitates prey capture. Photograph by R. W. Barbour.
Figure 10.9 The aquatic snake Erpeton tentaculatum uses appendages on the front of the head to detect tactile stimuli from fish when they approach the snake. Photograph by R. D. Bartlett.
Figure 10.10 The anatomical mechanics of an anuran projectile tongue (Rhinella marina). The four schematic stages show the projection sequence from tongue at rest on the floor of the oral cavity (top) to its full extension and capture of an insect (left). Five anatomical features are highlighted: the soft tissue of the tongue (stippled); two muscles (black), the genioglossus from the hyoid to the base of the tongue and the hyoglossus from the mentomeckelian element (mm) to the base of the tongue; and two skeletal elements (white), the hyoid horn lying below the tongue and mm at the tip of the jaw. Projection begins (right) with the mouth opening; the mm snaps downward by the contraction of a transverse mandibular muscle (not shown), and the genioglossus contracts to stiffen the tongue. The tongue flips forward (bottom) from the momentum generated by the downward snap of the mentomeckelian element and the genioglossus contraction; the two tongue muscles then relax and are stretched. The tongue is fully extended and turned upside down (left), and the dorsal surface of the tongue tip encircles the prey. The genioglossus and hyoglossus muscles contract, drawing the tongue with the adhering insect back through the mouth as it closes. Adapted from Gans and Gorniak, 1982.
Figure 10.11 By waving its brightly colored tail, Bothrops jararaca attracts frogs and other small insectivorous animals within strike range. The insert shows the contrast between the tail color (yellow in life) and the cryptic coloration of the snake. Adapted from Sazima, 1991. Photograph by I. Sazima.
Figure 10.12 Some frogs, such as Ceratophrys cornuta, use pedal luring to attract prey. The light color of the hind toes disappears as the frogs increase in size. Photograph by J. P. Caldwell.
Figure 10.13 Juvenile Aldabran tortoises (Geochelone gigantea) eating a leaf from their shade tree. Photograph by G. R. Zug.
Figure 10.14 The mollusk-eating snake Dipsas indica uses inertial feeding behavior to swallow a large slug (left) and extended teeth on the lower jaw to extract a snail from its shell (right). Photographs by I. Sazima.
Figure 10.15 Following prey detection and strike and grasp, many snakes, like this Burmese python, coil around their vertebrate prey. Not only does constriction subdue the prey, but it also causes circulatory failure, which kills the prey. Photograph by S. C. Secor.
Figure 10.16 Venomous snakes have movable (Viperidae) or fixed (Elapidae, some Colubridae) fangs to inject venom. Venom is delivered to the fangs from the venom glands via venom ducts. Modeled after a drawing of a taipan, Oxyuranus scutellatus, in Shine, 1991.
Figure 10.17 The anatomical mechanics of a salamander and a chameleon tongue. Salamanders redrawn from Duellman and Trueb (1986); chameleon redrawn from Kardong (1998).
Figure 10.18 Unlike most frogs, the microhylid frog Phrynomantis bifasciatus can extend its tongue in an arc of 105° to either side of center to capture prey. It does so using hydrostatic force to push the tongue directly out of the mouth. Adapted from Meyers et al., 2004.
Figure 10.19 Ballistic tongues of some chameleons, such as this Chamaeleo pardalis, can extend out more than two times the length of the lizard's body. The short section of the tongue nearest the head that is directed slightly upward contains the process entoglossus, which is part of the hyglossal skeleton that is situated inside the tongue and gives it support. Photograph by M. Vences and F. Rauschenbach.
Figure 10.20 Floor of the mouth of the tadpole of Pseudacris regilla. Tadpoles have several mechanisms for filtering food particles from the water taken into their mouths. Large food particles are channeled into the esophagus by rows of papillae on the floor and roof of the mouth. Smaller particles are strained out of the water as it passes through elaborately folded filters located on the gill bars. Even smaller particles are trapped in mucous strands secreted from glands located in the mouth. Adapted from Wassersug, 1976.
Figure 10.21 Representative diets of a frog, Leptodactylus mystaceus, and a lizard, Anolis nitens, that occur in the same microhabitat (leaf litter) in an Amazonian rain forest. Both species feed on a variety of arthropods and other invertebrates, but the diets are considerably different. In both species, a few prey categories dominate the diet. Volumetric data, which indicate energy gain, are not always reflected in numerical data, which indicate the cost of acquiring prey. Unpublished data from Vitt and Caldwell.
Figure 10.22 An examination of the shapes of prey fed on by species of sea snakes reveals that the majority of species feed primarily on fish that are elongate and nearly circular in cross section. The last two columns represent fish eggs and squids. Adapted from Voris and Voris, 1983.
Figure 10.23 Both the mean size of prey eaten and the maximum prey size (not shown here) are correlated with body size of frogs and lizards. Even though a strong correlation exists with all species included, species differences in the relationship also exist. In general, species that feed on the smallest prey, mites and ants, tend to eat smaller prey and more of them than species eating other prey types. Frog species are Elachistocleis ovalis = x, Leptodactylus andreae = upright triangle, Leptodactylus bolivianus = parallelogram with cross, L. fuscus = closed parallelogram, L. mystaceus = closed upside-down triangle, Leptodactylus lineatus = open star, Physalaemus ephippifer = closed square, and Pseudopaludicola boliviana = open square with cross. Lizard species are Anolis nitens = open circle, Coleodactylus amazonicus = open parallelogram, C. septentrionalis = cross, Arthrosaura reticulata = open square, Gymnophthalmus underwoodi = closed triangle, Leposoma percarinatum = upside-down open triangle, and Tretioscincus oriximinensis = closed circle. Adapted from Caldwell and Vitt, 1999.
Figure 10.24 Body sizes of herbivorous lizards showing that herbivorous Phymaturus and Liolaemus are smaller than all other herbivorous lizards, with body sizes falling well into the size distribution for insectivorous lizards. Adapted from Espinoza et al., 2004.
Figure 10.25 The diets of four species of water snakes change with age and size. Adapted from Mushinsky et al., 1982.
Figure 10.26 Although both head width and length increase with body size (snout-vent length) in Plethodon cinereus, head width of juveniles is proportionately greater in juveniles, which allows them to feed on relatively large prey. Adapted from Maglia, 1996.
Figure 10.27 In dendrobatoid frogs, the evolution of specialization on ants is linked with aposematic coloration and production of skin toxins. Ants (myrmicine ants in particular) produce the alkaloids for chemical defense against predators; frogs eat the ants and are able to either move the alkaloids to the skin or combine them with other chemicals and move them to the skin and use them for predator defense. Bright coloration of these frogs usually, but not always, signals to a predator that the frog is distasteful or toxic. Ant icons indicate a dietary shift to ant specialization based on an a priori categorization of generalists versus specialists. Shaded boxes indicate conspicuously colored frog species, and asterisks indicate that the species are known to contain alkaloids in the skin. Frequency histograms on the right indicate relative volume contributed by the 15 most common prey types to the diet of each frog species for which dietary data were available, and these are indicated in the phylogeny by boldfaced type. Numbers to the right of frog species names in the diet panel refer to the principal components scores of dietary niche breadths, essentially ranking frogs across prey types. Note that we have retained genera and species names as in the original graphic, and thus they are inconsistent with the taxonomy that appears in Chapter 17, with the following clade names: Aromobatidae (Dendrobatidae [Hyloxalinae {Colosthethinae+Dendrobatinae}]). Nevertheless, phylogenetic relationships are the same, and as a result, interpretations regarding evolution of diets, coloration, and defensive chemicals remain unchanged. For the interested reader, we suggest tracking species names on the Web site http://research.amnh.org/herpetology/amphibia/. Adapted from Darst et al., 2005.