Download
1 / 1
330 likes | 1.27k Views
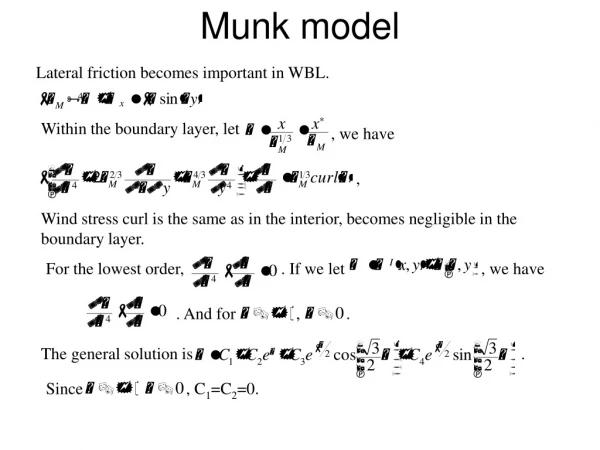
horizon. depth /cm. TOC /%. S /cm -1. K /cm -1. IVCv. 115-140. 0,09. 80. 31. IIICv. 85-115. 0,11. 91. 38. SdBv 2. 50-80. 0,14. 108. 44. SdBv 1. 24-50. 0,30. 115. 61. Bv. 5-24. 0,98. 112. 92. Ah. 0-5. 8,26. -. -. IICv. -. 0,19. 364. 58. Ah [1]. -. 3,50.

E N D
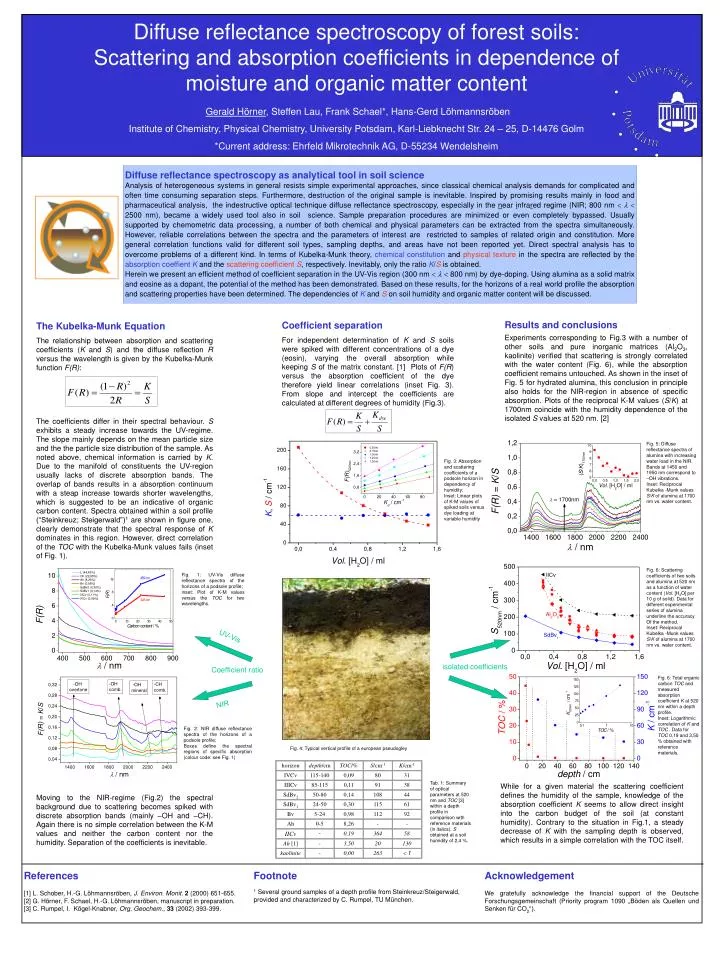
horizon depth/cm TOC/% S/cm-1 K/cm-1 IVCv 115-140 0,09 80 31 IIICv 85-115 0,11 91 38 SdBv2 50-80 0,14 108 44 SdBv1 24-50 0,30 115 61 Bv 5-24 0,98 112 92 Ah 0-5 8,26 - - IICv - 0,19 364 58 Ah [1] - 3,50 20 130 kaolinite - 0,00 263 1 Diffuse reflectance spectroscopy of forest soils: Scattering and absorption coefficients in dependence of moisture and organic matter content Gerald Hörner, Steffen Lau, Frank Schael*, Hans-Gerd Löhmannsröben Institute of Chemistry, Physical Chemistry, University Potsdam, Karl-Liebknecht Str. 24 – 25, D-14476 Golm *Current address: Ehrfeld Mikrotechnik AG, D-55234 Wendelsheim Diffuse reflectance spectroscopy as analytical tool in soil science Analysis of heterogeneous systems in general resists simple experimental approaches, since classical chemical analysis demands for complicated and often time consuming separation steps. Furthermore, destruction of the original sample is inevitable. Inspired by promising results mainly in food and pharmaceutical analysis, the indestructive optical technique diffuse reflectance spectroscopy, especially in the near infrared regime (NIR; 800 nm 2500 nm), became a widely used tool also in soil science. Sample preparation procedures are minimized or even completely bypassed. Usually supported by chemometric data processing, a number of both chemical and physical parameters can be extracted from the spectra simultaneously. However, reliable correlations between the spectra and the parameters of interest are restricted to samples of related origin and constitution. More general correlation functions valid for different soil types, sampling depths, and areas have not been reported yet. Direct spectral analysis has to overcome problems of a different kind. In terms of Kubelka-Munk theory, chemical constitution and physical texture in the spectra are reflected by the absorption coeffient K and the scattering coefficient S, respectively. Inevitably, only the ratio K/S is obtained. Herein we present an efficient method of coefficient separation in the UV-Vis region (300 nm 800 nm) by dye-doping. Using alumina as a solid matrix and eosine as a dopant, the potential of the method has been demonstrated. Based on these results, for the horizons of a real world profile the absorption and scattering properties have been determined. The dependencies ofK and S on soil humidity and organic matter content will be discussed. Results and conclusions Experiments corresponding to Fig.3 with a number of other soils and pure inorganic matrices (Al2O3, kaolinite) verified that scattering is strongly correlated with the water content (Fig. 6), while the absorption coefficient remains untouched. As shown in the inset of Fig. 5 for hydrated alumina, this conclusion in principle also holds for the NIR-region in absence of specific absorption. Plots of the reciprocal K-M values (S/K) at 1700nm coincide with the humidity dependence of the isolated S values at 520 nm. [2] Coefficient separation For independent determination of K and S soils were spiked with different concentrations of a dye (eosin), varying the overall absorption while keeping S of the matrix constant. [1] Plots of F(R) versus the absorption coefficient of the dye therefore yield linear correlations (inset Fig. 3). From slope and intercept the coefficients are calculated at different degrees of humidity (Fig.3). The Kubelka-Munk Equation The relationship between absorption and scattering coefficients (K and S) and the diffuse reflection R versus the wavelength is given by the Kubelka-Munk function F(R): The coefficients differ in their spectral behaviour. S exhibits a steady increase towards the UV-regime. The slope mainly depends on the mean particle size and the the particle size distribution of the sample. As noted above, chemical information is carried by K. Due to the manifold of constituents the UV-region usually lacks of discrete absorption bands. The overlap of bands results in a absorption continuum with a steap increase towards shorter wavelengths, which is suggested to be an indicative of organic carbon content. Spectra obtained within a soil profile (“Steinkreuz; Steigerwald”)1 are shown in figure one, clearly demonstrate that the spectral response of K dominates in this region. However, direct correlation of the TOC with the Kubelka-Munk values fails (inset of Fig. 1). Moving to the NIR-regime (Fig.2) the spectral background due to scattering becomes spiked with discrete absorption bands (mainly –OH and –CH). Again there is no simple correlation between the K-M values and neither the carbon content nor the humidity. Separation of the coefficients is inevitable. Fig. 5: Diffuse reflectance spectra of alumina with increasing water load in the NIR. Bands at 1450 and 1950 nm correspond to –OH vibrations. Inset: Reciprocal Kubelka -Munk values S/K of alumina at 1700 nm vs. water content. Fig. 3: Absorption and scattering coefficients of a podsole horizon in dependency of humidity; Inset: Linear plots of K-M values of spiked soils versus dye loading at variable humidity Fig. 6: Scattering coefficients of two soils and alumina at 520 nm as a function of water content (Vol. [H2O] per 10 g of solid). Data for different experimental series of alumina underline the accuracy Of the method. Inset: Reciprocal Kubelka -Munk values S/K of alumina at 1700 nm vs. water content. Fig. 1: UV-Vis diffuse reflectance spectra of the horizons of a podsole profile; inset: Plot of K-M values versus the TOC for two wavelengths. UV-Vis isolated coefficients Coefficient ratio Fig. 6: Total organic carbon TOC and measured absorption coefficient K at 520 nm within a depth profile. Inset: Logarithmic correlation of K and TOC . Data for TOC 0,19 and 3,50 % obtained with reference materials. NIR Fig. 2: NIR diffuse reflectance spectra of the horizons of a podsole profile; Boxes define the spectral regions of specific absorption (colour code: see Fig. 1) Fig. 4: Typical vertical profile of a european pseudogley Tab. 1: Summary of optical parameters at 520 nm and TOC [3] within a depth profile in comparison with reference materials (in italics). S obtained at a soil humidity of 2,4 %. While for a given material the scattering coefficient defines the humidity of the sample, knowledge of the absorption coefficient K seems to allow direct insight into the carbon budget of the soil (at constant humidity). Contrary to the situation in Fig.1, a steady decrease of K with the sampling depth is observed, which results in a simple correlation with the TOC itself. Footnote 1 Several ground samples of a depth profile from Steinkreuz/Steigerwald, provided and characterized by C. Rumpel, TU München. References [1] L. Schober, H.-G. Löhmannsröben, J. Environ. Monit.2 (2000) 651-655. [2] G. Hörner, F. Schael, H.-G. Löhmannsröben, manuscript in preparation. [3] C. Rumpel, I. Kögel-Knabner, Org. Geochem., 33 (2002) 393-399. Acknowledgement We gratefully acknowledge the financial support of the Deutsche Forschungsgemeinschaft (Priority program 1090 „Böden als Quellen und Senken für CO2“).