Download
1 / 10
100 likes | 354 Views
APLIKASI GRAFIK PENGENDALI X- bar CHART UNTUK PH SABUN SIRIH PERUSAHAAN “X. OLEH : MARIANI JAYA SAPUTRA 662008009. produk. PROSES PRODUKSI. MUTU. CONTROL CHART. PENGEDALIAN. X-bar cHART. Statistical process control ( SPC ).

E N D
APLIKASI GRAFIK PENGENDALI X-bar CHART UNTUK PH SABUN SIRIH PERUSAHAAN “X OLEH : MARIANI JAYA SAPUTRA 662008009
produk PROSES PRODUKSI MUTU CONTROL CHART PENGEDALIAN X-bar cHART
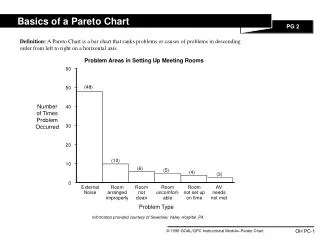
Statistical process control ( SPC ) • Statistical process control(SPC) adalah penerapanteknikstatistikuntukmengukurdanmenganalisavariasi yang terjadiselamaprosesproduksiberlangsung. Salahsatualat SPC untukmendetaksiketikaprosesdalamkeadaantidakterkendali (out of control) adalah control chart.Control chart merupakanbentukgrafik yang digunakansebagaialat bantu dalampengendalianproses. Grafikiniberbentukgarispatah-patahataupolygon yang memberikaninformasitentangkeadaanproses, apakahdalamkeadaanterkontrolataudiluarkendali. Terdapatduajenis control chart untuk data variabel, yakniX-bar dan R.
X-bar Chart • PetakontrolX-barmenjelaskantentangapakahperubahan-perubahantelahterjadidalamukurantitikpusatatau rata-rata darisuatuproses. • Padadasarnyasetiappetakontrolmemilikigaristengah (central line) dinotasikandengan CL dansepasangbataskontrol (control limits), satubatas control ditempatkandiatasgaristengahsebagai Batas KontrolAtas (Upper Control Limits-UCL), dansatulagidibawahgaristengahsebagai Batas KontrolBawah (Lower Control Limits-LCL).
X-bar chart dengan UCL= 3.9 dan LCL=3.5. UCL dan LCL sebagai batas atas dan bawah untuk PH sabun sirih yang telah ditetapkan oleh perusahaan.Dari grafik diatas dapat diambil kesimpulan bahwa kadar PH sabun sirih masih dala kendali perusahaan.
UCL dan LCL sebagai batas atas dan bawah individu untuk PH sabun sirih.Dari grafik diatas dapat diambil kesimpulan bahwa kadar PH sabun sirih masih dalam kendali perusahaan.