Download
1 / 11
110 likes | 117 Views
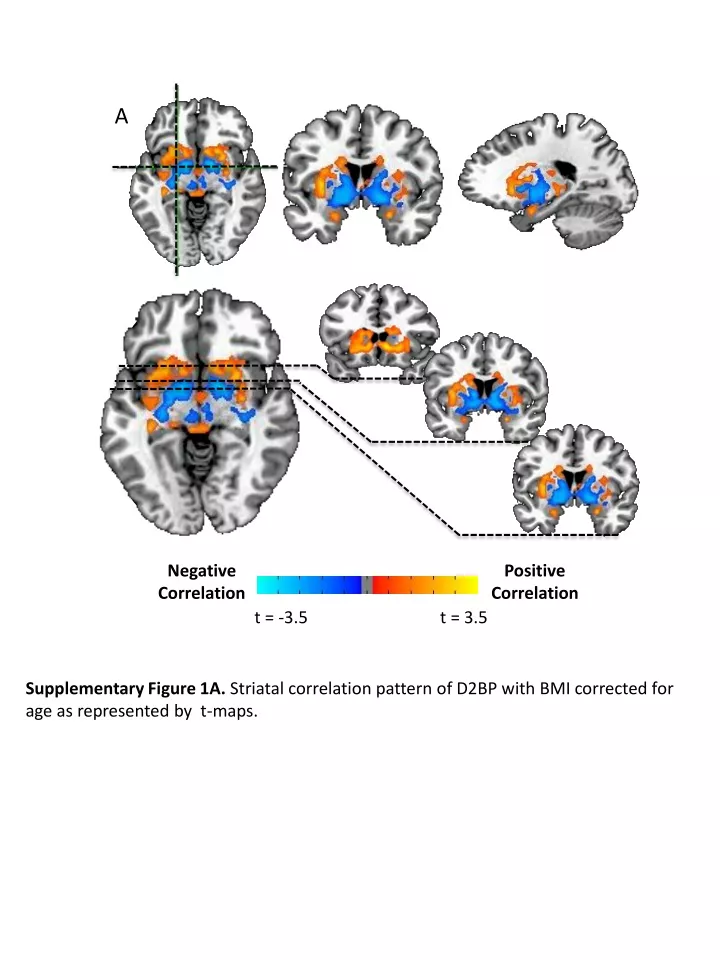
A. Positive Correlation. Negative Correlation. t = -3.5. t = 3.5. Supplementary Figure 1A. Striatal correlation pattern of D2BP with BMI corrected for age as represented by t-maps. B. Negative Slope. Positive Slope.

E N D
A Positive Correlation Negative Correlation t = -3.5 t = 3.5 Supplementary Figure 1A. Striatal correlation pattern of D2BP with BMI corrected for age as represented by t-maps.
B Negative Slope Positive Slope Supplementary Figure 1B. Striatal associations between D2BP and BMI corrected for age as represented by β-maps in significant clusters after correcting for multiple comparisons. β = 1 β = -1
A Positive Correlation Negative Correlation t = -3.5 t = 3.5 Supplementary Figure 2A. Striatal correlation pattern of D2BP with opportunistic eating behavior corrected for age as represented by t-maps.
B Negative Slope Positive Slope Supplementary Figure 2B. Striatal associations between D2BP and opportunistic eating behavior corrected for age as represented by β-maps in significant clusters after correcting for multiple comparisons. β = 3.5 β = -3.5
A Positive Correlation Negative Correlation t = -3.5 t = 3.5 Supplementary Figure 3A. Striatal correlation pattern of D2BP with HOMA-IR as represented by t-maps.
B Negative Slope Positive Slope Supplementary Figure 3B. Striatal correlations of D2BP with HOMA-IR as represented by β-maps within significant clusters after correcting for multiple comparisons. β = 3.5 β = -3.5
Positive Correlation Negative Correlation t = -3.5 t = 3.5 Supplementary Figure 4. Striatal correlation pattern of D2BP with HOMA-IR corrected for age as represented by t-maps.
Positive Correlation Negative Correlation t = -3.5 t = 3.5 Supplementary Figure 5. Striatal correlation pattern of D2BP with body fat mass represented as t-maps.
Positive Correlation Negative Correlation t = -3.5 t = 3.5 Supplementary Figure 6. Striatal correlation pattern of D2BP with body fat mass corrected for age represented as t-maps.
A B C Supplementary Figure 7. Correlations between dopamine D2-like receptor binding potential (D2BP) and body fat mass within striatal regions of interest. Positive correlations were found in (A) caudate, and (B) putamen, but not in (C) the accumbens area.
A B C Negative Correlation Positive Correlation D BP = 0 t = -3.5 t = 3.5 BP = 30 Supplementary Figure 8. D2BP and BMI correlations within ROIs defined in Talairach space as represented by t-maps of : (A) caudate, (B) putamen, and (C) accumbens. (D) Binding potential (BP) map in the striatum.