Download
1 / 9

E N D
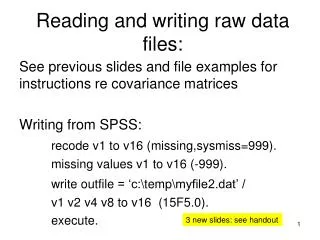
Reading Data Computer, Minitab, and other printouts
1. A sample of men agreed to participate in a study to determine the relationship between several variables including height, weight, waste size, and percent body fat. A scatterplot with percent body fat on the y-axis and waist size (in inches) on the horizontal axis revealed a positive linear association between these variables.Computer output for the regression analysis is given below:(a) Write the equation of the regression line (be sure to use correct notation and define your variables):
(b) Explain/interpret the information provided by R-squared in the context of this problem. Be specific. r2 = 67.8% 67.8% of the variation in percent body fat can be explained by the variation in waist size.
(c) Calculate and interpret the correlation coefficient (r). The correlation of .823 tells us that there is a fairly strong and positive relationship between percent body fat and waist size.
(d) One of the men who participated in the study had waist size 35 inches and 10% body fat. Calculate the residual associated with the point for this individual. Residual = = observed – predicted Residual = 10 – 16.766 = - 6.766
A dietitian obtains the amounts of sugar (in grams) from 1 gram in each of 16 different cereals, including Cheerios, Corn Flakes, Fruit Loops, Trix and 12 others. He enters the data into Minitab (statistical software) and gets the following output:(a) What measures of center are displayed in the data and what are their values? Total Variable Count Mean SE Mean StDev Variance CoefVar Minimum Q1 C1 16 0.3281 0.0480 0.1920 0.0369 58.51 0.0300 0.1300 Variable Median Q3 Maximum C1 0.4100 0.4650 0.7000 Mean = 0.3281 Median = 0.4100
A dietitian obtains the amounts of sugar (in grams) from 1 gram in each of 16 different cereals, including Cheerios, Corn Flakes, Fruit Loops, Trix and 12 others. He enters the data into Minitab (statistical software) and gets the following output:(b) What measures of spread can be found using the data? Total Variable Count Mean SE Mean StDev Variance CoefVar Minimum Q1 C1 16 0.3281 0.0480 0.1920 0.0369 58.51 0.0300 0.1300 Variable Median Q3 Maximum C1 0.4100 0.4650 0.7000 Standard Deviation = 0.1920 IQR = Q3 – Q1 = 0.4650 – 0.1300 = 0.3350
(c) How could we determine if there are any outliers? Total Variable Count Mean SE Mean StDev Variance CoefVar Minimum Q1 C1 16 0.3281 0.0480 0.1920 0.0369 58.51 0.0300 0.1300 Variable Median Q3 Maximum C1 0.4100 0.4650 0.7000 Use the IQR = 0.3350. IQR X 1.5 = 0.3350 X 1.5 = 0.5025 Q3 + 0.5025 = 0.9675 Q1 – 0.5025 = - 0.3725 Compare to Minimum and Maximum values. If either are outside of this range, there are outliers. If not, there aren’t any. Because Min = 0.0300 and Max = 0.7000, there are no outliers.
Y-intercept Standard error t - statistic p - value Slope Correlation