Download
1 / 9
90 likes | 212 Views
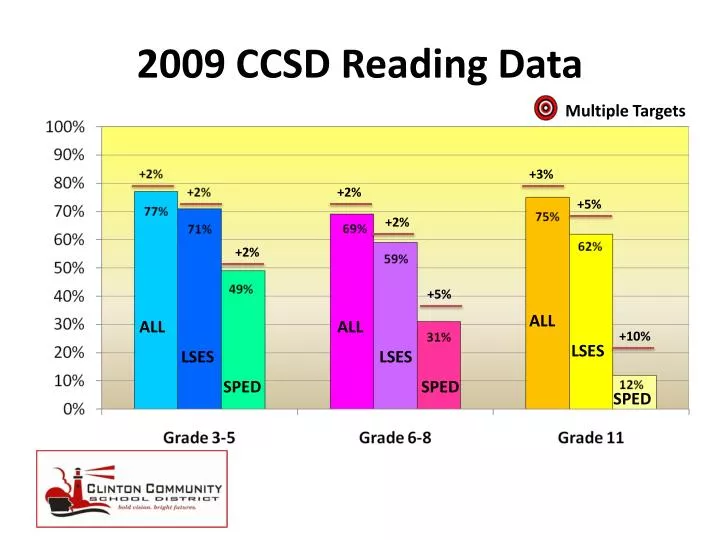
2009 CCSD Reading Data. Multiple Targets. +3%. +2%. +5%. +2%. +2%. +5%. ALL. ALL. ALL. +10%. LSES. LSES. LSES. SPED. SPED. SPED. 2009 CCSD Math Data. Multiple Targets. +2%. +2%. +2%. +3%. +2%. +2%. +5%. +5%. ALL. ALL. ALL. +10%. LSES. LSES. LSES. SPED. SPED.

E N D
2009 CCSD Reading Data Multiple Targets +3% +2% +5% +2% +2% +5% ALL ALL ALL +10% LSES LSES LSES SPED SPED SPED
2009 CCSD Math Data Multiple Targets +2% +2% +2% +3% +2% +2% +5% +5% ALL ALL ALL +10% LSES LSES LSES SPED SPED SPED
2009 CCSD Science Data Multiple Targets +2% +2% +2% +3% +2% +2% +5% +5% +10% ALL ALL ALL LSES LSES LSES SPED SPED SPED
NWEA READING Student Growth Fall-Spring, Grades 3-5, 6-8 Target = 100.0%
NWEA MATH Student Growth Fall-Spring, Grades 3-5, 6-8 Target = 100.0%
CCSD - ATTENDANCE STUDENT Target = 94.17% + .33%
CCSD - ATTENDANCE TEACHER Target = 93.5% + .76%
District BEHAVIOR - Average Events Per Day Target = 13.75 13.75
District BEHAVIOR:Students With NO Office Referrals Target = 84% 84%