Download
1 / 26
260 likes | 386 Views
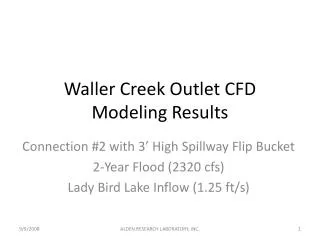
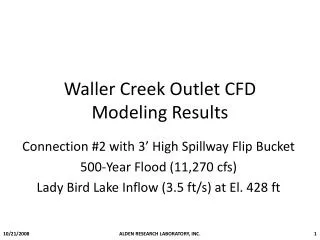
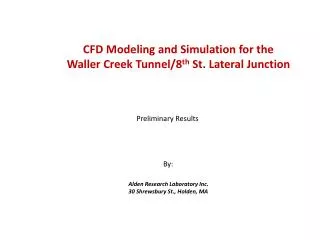
Waller Creek Intake CFD Modeling and Simulation. Flood Control Turning Vane Design. Preliminary Results. September 18, 2009. ALDEN Research Laboratory Inc. 30 Shrewsbury St., Holden, MA 01520. CFD model geometry with proposed flood control turning vane. Flood control turning vane.

E N D
Waller Creek IntakeCFD Modeling and Simulation Flood Control Turning Vane Design Preliminary Results September 18, 2009 ALDEN Research Laboratory Inc. 30 Shrewsbury St., Holden, MA 01520
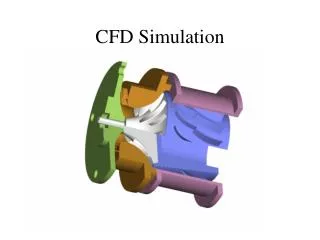
CFD model geometry with proposed flood control turning vane Flood control turning vane Flood control turning vane Isometric view 1 Isometric view 2
CFD model geometry with proposed flood control turning vane Flood control turning vane
Average velocity (in the bar screen area) (velocity color scale is the actual velocity ) Time = 2540 sec. 6 1 V1 = 3.4 ft/s V6 = 3.32 ft/s 5 2 4 3 V2 = 3.07 ft/s V5 = 3.14 ft/s V4 = 2.04 ft/s V3 = 3.63 ft/s
Percent of bar screen area at or below 4 ft/s (velocity color scale is the actual velocity ) Time = 2540 sec. 1 6 80.12 % 88.76 % 2 5 4 3 95.19 % 98.6 % 100 % 80.13 %
Velocity contour through each bar screen (velocity color scale is the actual velocity ) Time = 2540 sec. Iso-view 1 6 5 4 1 3 2
Velocity contour through each bar screen (velocity color scale is the actual velocity ) Time = 2540 sec. Iso-view 2 1 6 5 2 3 4
Velocity contour through each bar screen (velocity color scale is the actual velocity ) Time = 2540 sec. Iso-view 3 1 2 6 3 5 4
Velocity contour at different locations with different color scales Time = 2540 sec.
Plot of velocity contours with vectors (slice plane cut at elevation 476 ft.) Isometric View Time = 2540 sec. Same with slide 10 with different color scale
Iso-surface plot of water colored with velocity magnitude Isometric View Time = 2540 sec.
Iso-surface plot of water colored with velocity magnitude Isometric View Time = 2540 sec. same with slide 11 but different color scale Same with slide 10 with different color scale