Download
1 / 58
590 likes | 703 Views
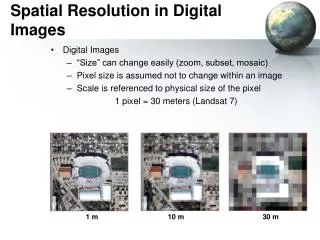
Agronomic Spatial Variability and Resolution. Spatial Variability Sampling Strategies. Sampling Strategies. Random Sampling - Sample the entire field randomly and composite the sample.

E N D
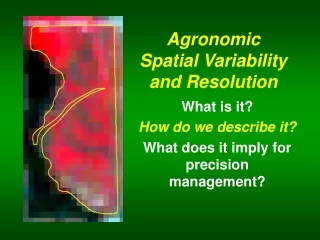
Agronomic Spatial Variability and Resolution Spatial Variability Sampling Strategies
Sampling Strategies • Random Sampling - Sample the entire field randomly and composite the sample. • Stratified Random Sampling - Divide the field into zones or areas based on agronomic reasons. Randomly sample and composite samples with the zone. • Grid Sampling - Sample at a fixed interval or grid. Treat each the entire cell or field element based on the sample from that cell. OR Use some interpolation scheme to predict values between sample points.
Field Element or Cell Size 6x66 7x70 6x6 3x3 2x2 Random Sampling Fixed Interval or Grid Sampling Stratified Random Sampling Sampling Zone Width
Number of randomly selected samples required to reach 10, 5, and 2 % error from the true average value with a 90% probability
Conclusions • Random sampling and stratified random sampling strategies require a similar number of samples to precisely describe the mean value of the soil variables measured in the 7 ft by 70 ft area. • Fixed interval sampling required more samples to produce the same precision as random or stratified random sampling. • The OSU recommendation of collecting 15 to 20 soil samples and averaging them should give us an estimate within 5 to 10% of the true mean value.
Conclusions • Stratified random sampling may provide a more precise measure of the true mean, when it is known that in local regions the measured value is related and not randomly distributed.
Drawing Lines • Lines for zones based on 1 factor • Yield History • Yield levels • Yield Stability • Topography • Soil Type • Soil EC • Geography / boundaries • Organic Matter • Nutrient levels
Electrical Conductivity (EC) • Soil EC is soil electrical conductivity– a measurement of how much electrical current soil can conduct. It’s an effective way to map soil texture because smaller soil particles such as clay conduct more current than larger silt and sand particles. Soil EC measurements have been used since the early 1900’s- • Veris mobilized the process and added GPS. As the Veris EC cart is pulled through the field, one pair of coulter-electrodes injects a known voltage into the soil, while the other coulter-electrodes measure the drop in that voltage. • The result: a detailed map of the soil texture variability in the crop rooting zone
Deteriming the Variable • Using 1 factor to determine other unrelated factors P P K Elevation
Soil pH Shallow EC K Elevation P
Partners in Research • Yield closely related to BI <.0001, • Yield not statistically related to any other variable. Relationship between all micros Sig but negatively. • Yield best related to depth to limiting layer. Trend is holding at specific sites
Soil pH P Shallow EC Buffer Index
Variability in your fields • Zone Management • What is the Product? • Yield Based • Topography based • Soil based • Grid Soil Sampling • What is the product? • Is it worth the money?
Summary • All techniques are potentially the right way and the wrong way. • MUST have variability before you treat for variability! • Sometimes Nutrient needs are the same sometimes its not, more often its not. • Look at the cost of the method versus the economics of the production system.
Outline • Perfection • Impact of Institutional Knowledge • Resolution • Zones • Layers
Perfection P & K • Immobile P and K • Soil and Crop Driven • First Year evaluate response
Perfection P & K • Immobile P and K • Rate Studies in each zone 10 lbs 10 lbs 10 lbs 20 lbs 20 lbs 20 lbs 30 lbs 30 lbs 30 lbs 40 lbs 40 lbs 40 lbs
Perfection P & K • Understand the Benefits and Limitations of Soil Testing • Broad sweeping recommendations • Recommendations are Conservative in both directions • Will recommend only when likely to respond • Rate will ensure maximum yield for the majority
Perfection N • Mobile Nutrients N, S, B • Yield Driven!! • Make determinations based off Environment and Plant measured in Season High / Adequate Rate