Download
1 / 32
320 likes | 489 Views
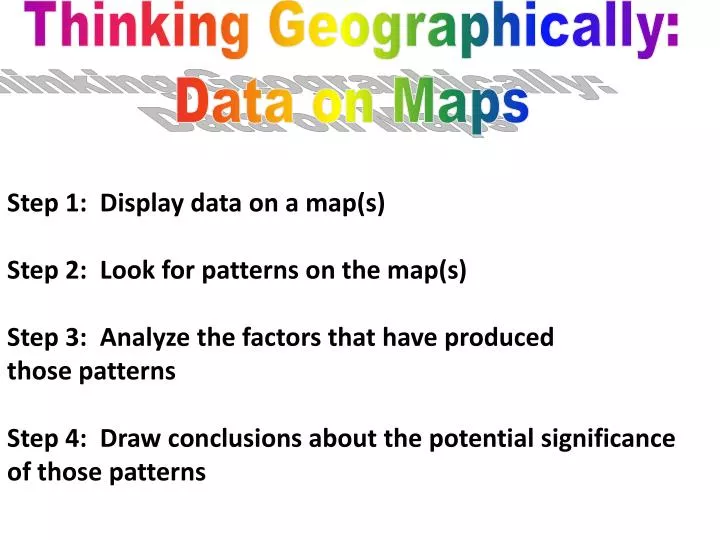
Thinking Geographically: Data on Maps. Step 1: Display data on a map(s) Step 2: Look for patterns on the map(s) Step 3: Analyze the factors that have produced those patterns Step 4: Draw conclusions about the potential significance of those patterns. What is this map missing?.

E N D
Thinking Geographically: Data on Maps Step 1: Display data on a map(s) Step 2: Look for patterns on the map(s) Step 3: Analyze the factors that have produced those patterns Step 4: Draw conclusions about the potential significance of those patterns
Finding scale: • - Find a similar map in an atlas • Pick two common points on both maps that you could easily measure the straight line distance between those two points in centimetres • - Use the map in the atlas and its scale and determine the actual distance in kilometres between those two points • Now, set up a ratio – • NHL map distance between the two pts.(cm): Actual distance (km) • Divide both sides of the ratio by the number of centimetres to reduce it down to – 1cm: __________km eg from the NW tip of Washington state to the western tip of Lake Superior 2500 km 12.5cm: 2500km 12.5 /12.5 cm : 2500/12.5 km 1cm represents 200km (a verbal scale) - This final scale could also be shown as a linear scale or as a representative fraction i.e. 1: 20 000 0000 Note: 100 000 cm = 1 km
1) Facts based solely on the information given on the 1982 map: – 14 American based teams, 7 Canadian based teams, no Mexican based teams, 21 teams in total - students may also start indicating patterns
2) Patterns • Most are located in the east / northeast • Most NHL teams are in the United States • Located in major cities • Most NHL cities are near major water bodies i.e. Great Lakes, St. Lawrence river, Atlantic Ocean, Pacific Ocean • With the exception of LA and Vancouver, all the NHL cities have cold winters • Nicknames generally have a cultural, historical, or economic connection to the city
3) Why do these patterns exist? • North American settlement from Europe started in the East so major population centres developed their first near major water bodies which provide fishing opportunities, trade routes and fresh water for human consumption, agriculture, and industrial purposes – i.e. the industrial heartland of North America around the Great Lakes / St. Lawrence region • Need major population centres to provide the fans and corporate support for an NHL franchise
Original six NHL franchises:NY Rangers, Montreal, Toronto, Chicago, Detroit, Boston • Tradition of outdoor hockey in cold climate cities started interest in the sport • Much larger US population and economy encourages more franchises to be located there especially in the northeast
4) What difference does it make? • NHL teams generate millions of dollars in revenue for cities, states / provinces, and nations (i.e. salaries, income taxes, spin off effects – restaurants / sports bars, taxis, hotels, etc.) • Cultural identity – 1982 - A strong majority of NHL players were Canadian1967 – 97% Canadian Today - ~ 55% Canadian)
Facts based solely on the information given on the 2010 map: • 24 American based teams, 6 Canadian based teams, no Mexican based teams, 30 teams in total • students may also start indicating patterns
6) Changes in the patterns since 1982 • More teams • Expansion into the southern United States and more teams in the West + Ottawa • Loss of Winnipeg Jets, Quebec Nordiques, Hartford Whalers, Colorado Rockies, and Minnesota North Stars • Teams in warmer climates • Still eastern domination for # of teams • Still most teams near major water bodies
7) Why did these changes happen? Growing interest in hockey during the 1990s due to: • Gretzky trade from Edmonton to LA (1988) sparked much greater interest in California and the USA as a whole.
NHL focused on expansion in the American market during a period of rapid growth in the US economy i.e. the high tech boom eg San Jose / Silicon Valley
Return of NHL hockey to network US televisioni.e. Fox network with its glowing puck and comet for slap shots i.e. FoxTrax 1996 All Start Game YouTube
1980 Winter Olympics @ Lake Placid New York; USA beat the Soviet Union in the semi-finals in a massive upset and then went on to win the gold medal – inspired young Americans to play hockey and therefore, more Americans in the NHL in the 1990s. Clip from movie “Miracle” – intense practice YouTube
End of the cold war in 1989 allowed Russians and Czechs, in particular, to legally come to the NHL; therefore more players available to support a 30 team league • Loss of smaller Canadian market franchises (i.e. Winnipeg to Phoenix in 1996 and Quebec to Colorado in 1995) due to rising player salaries, a lower Canadian dollar (i.e. ~ $0.72US in the mid.-90s to ~$0.62US in 2002) as players are paid in US funds, and a lack of corporate support
8) Why are these changes significant? • Economic: • Will Canada lose any more franchises? orWill teams come back to Canada due to: • Salary cap in the NHL collective agreement • Declining attendance in some US markets while most Canadian teams sell out each game + relatively poor tv ratings in the USA (exceptions – Winter Classic Outdoor Game + 2010 & 2011 Playoffs) • A much higher Canadian dollar i.e. ~$0.97US in June 2012
Cultural: • Has Canada lost some of its hockey prowess with so many franchises in the US and a lower % of Canadian NHL players? or • Is Canada successfully exporting its culture abroad? or • Is Canada still the hockey powerhouse of the world? eg Women’s Olympic Gold Medal Hockey Champions (2010, 2006, 2002), Men’s Olympic Gold Medal Hockey Champions (2010, 2002), World Junior Champions (2005-2009)
Historical: • We can tie world events (i.e. end of the Cold War) to changes in the NHL • Many memorable moments in Canadian history are tied to hockey • Is hockey the glue that unites Canadians???
2010 Vancouver Winter Olympics – Gold on Home Ice!!! (Sidney Crosby’s overtime winner against USA)
2002 Salt Lake City Winter Olympics – First Gold in 50 years
1987 Canada Cup Canada and the Soviet Union met in the three game finale. Each game finished in a 6-5 score culminating with Mario Lemieux’s Cup winning goal off a pass from Wayne Gretzky.Final Game Goals YouTube
1972 Summit Series Game 1 USSR 7 – Canada 3 Game 2 Canada 4 – USSR 1Game 3 Canada 4 – USSR 4 Game 4 USSR 5 – Canada 3 Phil Esposito YouTubeGame 5 USSR 5 – Canada 4Game 6 Canada 3 – USSR 2Game 7 Canada 4 – USSR 3Game 8 Canada 6 – USSR 5Game 8 YouTube
A few examples of Other Potential Sets of Data to identify patterns and attempt to explain – Unemployment rates (May 2012) Source: Statistics Canada (7.3%) (12.0%) (7.4%) (4.5%) (5.1%) (7.8%) (4.5%) (11.3%) (7.8%) (9.2%) (9.4%)