Download

1 / 39
390 likes | 517 Views
Workshop Simulated Licence Round 8 th - 10 th February 2012. Petroleum Economics. Workshop Outline … part 1. Workshop Outline … part 1. You have been divided into groups of 8-9

E N D
Workshop Simulated Licence Round 8th - 10thFebruary 2012 Petroleum Economics
Workshop Outline … part 1 • You have been divided into groups of 8-9 • Each group is an exploration company (you’ll need a name) interested in bidding for blocks in an upcoming licenceround • The exercise will be run in parallel with 9 teams in each set
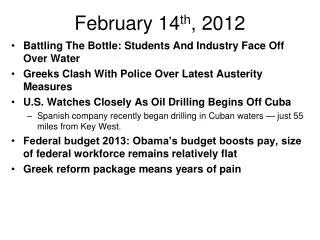
Geological Information • You each have access to the same set of base data, which includes a map of the blocks on offer, prospect outlines, isopach data on the only prospective interval, and data on six wells adjacent to the blocks on offer • Seismic data are first class over the entire area, and you have all mapped the top and base of the only prospective reservoir (a Tertiary channel sand) in an identical way. • You therefore all have identical gross sand isopach interpretations (contour interval 100 ft) and prospect outlines:
¡ ¡ ¡ Investment Appraisal Exercise9-block Licence Award Area 0 .1 Brechin 100 Aberdeen 2 Crieff 100 200 Forfar Edinburgh Dundee 5 200 . Glasgow Inverurie Helmsdale 3 . Orange areas are prospect outlines Black contours are 100 ft isopachs 0 4 6
Prospect Details • You have each planimetered the prospect maps in the same way, and have assessed the gross rock volumes of the various prospects as follows: [Remember that units are tricky ... GRV is measured in acre feet, and reserves are quoted in barrels, so use the conversion factor of 7758 barrels per acre foot.]
More Geological Information You all have the following information, and only this information, from the 6 wells drilled nearby: Well N/G Porosity SHC Re FVF (RB/STB) 1 0.80 0.32 0.80 0.45 1.15 2 0.600.260.00 N/A N/A 3 0.500.28 0.85 0.35 1.15 4 0.30 0.25 0.00 N/A N/A 5 0.65 0.28 0.00 N/A N/A 6 0.40 0.22 0.60 0.30 1.15 Wells 1, 3 and 6 all recovered oil, GOR about 100 scf/Bbl, gas volumes sufficient only for platform fuel
Upstream Oil Industry ... volumetric assessment - recap Recoverable Hydrocarbons GRV (Gross Rock Volume) * N/G (Net reservoir to Gross rock ratio) * Ø(Porosity) * Shc(hydrocarbon saturation of pore fluids) * 1/FVF (Formation Volume Factor) * RF (Recovery Factor) Basis: correlation with nearby wells/data
Assessing Risk - recap • Play Chance (%) • Reservoir presence (%) * Reservoir Effectiveness (%) • Seal presence (%) * Seal Effectiveness (%) • Source presence (%) * Source maturity (%) * Source migration (%) • Prospect Specific Risk (%) • Trap presence (%) * Trap effectiveness (%) • Reservoir presence (%) * Reservoir Effectiveness (%) • Seal presence (%) * Seal Effectiveness (%) • Source presence (%) * Source maturity (%) * Source migration (%) • Overall Chance of Success = Play Chance * Prospect Specific Risk
Assessing Risk • Assume the following: • Play is proven • Prospect Specific Risks are independent • Remember we are using a dice to decide when a well is successful, therefore your chance of success can only be • 1/6 (16.67%) • 2/6 (33.33%) • 3/6 (50%) • 4/6 (66.67%) • 5/6 (83.33%) • 6/6 (100%)
Workshop Output … part 1 • Assign an input distribution to Ø, N/G, Shc, FVF for each prospect. • You are supplied with the GRV and Re distributions to use in the work file • Complete a volumetric assessment of the nine blocks available for bid. • Estimate the chance of success for each prospect • Tabulate both unrisked and risked Resources for each prospect • Consolidate your risked and unriskedrecoverable Resource estimates to give the total Resource potential of the nine blocks • Calculate the chance of making at least 1 discovery if all 9 prospects are drilled
Workshop Outline … part 2 • Continue to work in your groups. • Use your volumetric and risk assessment of the nine blocks available for bid. • You are required to prepare cash bids for those blocks you wish to acquire, and each team has a budget of $1 billion for that purpose, $250 million from retained profits from the business and a $750 million borrowing facility. • Produce a risked valuation of each prospect and rank them in order of attractiveness to you. • Prepare a bid for at least 4 of the blocks
Workshop Outline … part 2 • If your bids are unsuccessful, or you choose not to spend all of your budget, then any remaining retained profits are invested safely at 6% pa compound interest, after tax, for the period during which exploration, appraisal and production activity takes place … the borrowing facility not needed is not used. • The successful bidder for each block will be decided by the Petroleum Minister based on the highest cash bid. The outcome of an exploration well on each of the prospects is determined by the throw of a dice. The values of each of the companies are determined by the Present Values of the discoveries, plus the compounded present value of unspent retained profits, less abortive costs.
Economic Modelling • Assemble the cash flows by year, considering the magnitude and timing of all the costs associated with purchasing, developing and producing the prospect. • You will be provided with a simple cash flow model • Calculate NPV’s and EMV for each prospect (3 point)
2012 2013 2014 2015 2016 2017 2018 2019 …… yr 0 yr 1 yr 2 yr 3 yr 4 yr 5 yr 6 yr 7 x Acquire licence x 2D seismic x Drill Expl. well (if successful) x 3D seismic x Drill Appr. Wells x x x Dev CAPEX x Dev Drilling x 1st production Project schedule
Economic Input • Costs: all amounts expressed in real US$ • Licence Acquisition - whatever you bid, in year zero • CAPEX, DRILLEX, OPEX, [ABEX] - Costs for all of these depend on field production rates. The following slides allow you to estimate costs for your prospects. • Forecast production – you will need to turn your recoverable oil volumes into annual production data (see following slides) • Bids must be made in US$
Seismic Costs • Assume the following: • 2D seismic costs US$1.5 million to acquire • 3D seismic costs US$6.0 million to acquire • 3D seismic takes 1 year to acquire and interpret
Drilling Costs (Drillex) • Assume the following: • all E&A wells cost US$35 million (REAL) • Exploration well is drilled in 2012 • all successes require appraisal (2014) • number of appraisal wells is related to level of resources (1 well for every 30 MMbbls) • Recovery of oil is around 10 MMbblsper development well • all Dev wells cost US$30 million (REAL) • Assume the following: • Subsea completion costs US$35 million (REAL) per producing well
FPSO Costs (CAPEX) Minimum CAPEX = US$400 milllion Assume CAPEX is spent evenly over 3 years prior to first production Tip: Plot CAPEX vs. Production rate and use plot to interpolate. Don’t forget the costs are linked to daily production rate not annual volume of oil
FPSO Costs (CAPEX) Tip: Use the plot of CAPEX vs. Production rate to derive a relationship between production rate and cost. Use this relationship to interpolate for the CAPEX in your cases. Don’t forget the costs are linked to daily production rate not annual volume of oil
Operating Costs (Opex) Annual fixed OPEX: Minimum fixed OPEX = US$35 per year Annual variable OPEX: Tip: Plot fixed and variable OPEX vs. Production rate and use plots to interpolate. Don’t forget the costs are linked to daily production rate not annual volume of oil
Production forecasts • The reservoirs are capable of producing 14% of the total resources per year at peak, and the facilities and wells should be costed accordingly. • Assume peak production is achieved instantaneously • Production will decline after 5 years on plateau or once 70% of the field's resources have been produced • Declining reservoir pressure means that production rates decline by 20% per year (declining balance basis).
Further Economic Input • Oil price, discount rate, inflation rate- some analysts currently advise $95/bbl flat real and 10% nominal, respectively. Please use these assumptions. The model will assume that the general inflation rate is 2% per annum. • Tax Rate - Corporation tax is currently levied at 50% of net revenues (i.e. gross revenues minus allowable expenditure) ... the spreadsheet does the calculation for you.
Oil price Quality Differential – 95% of Brent
Tip on how to get started • To do the valuation rigorously would require you to compute 27 net cash flows representing the P90, P50 and P10 cases for every prospect. • To save time plot unrisked NPV10 against unrisked recoverable resources. Complete as many cases as you can but do enough to define the shape of the curve. • Fit a trend line to the data and extract function • Use this to compute the NPV10 for your 27 cases and then the EMV10 of each prospect
NPV10 vs. Field Size Plot Minimum Commercial Field Size
Cost of Failure Cost of failure if discovered volume is < minimum commercial field size Cost of failure after dry hole
Tax position • Assume that this will be your first asset and your company is not yet in a tax paying position • Tax losses will be carried forward until they can be used (the model will do this for you) • If you are unsuccessful there will be no tax relief on your failure costs
Bid Table • Bids to be delivered in sealed envelope by lunch time on Friday • You must bid for at least 4prospects • List all 9 prospects in order of preference and indicate which you are submitting a bid for. • You should use EMV as the basis of your bids • If you decide to offer a premium over the EMV remember that the unrisked success NPV’s should be able to cover the bid • Label the bid sheet and envelope with your company name • Each team will only be awarded one prospect • Do not exceed your overall budget limit of $1000 million