Download
1 / 34
340 likes | 570 Views
Power Visualization, Analysis, and Optimization Tools for FPGAs. Matthew French, Li Wang and Michael Wirthlin USC, Information Sciences Institute, BYU. Outline . Introduction Background JDHL Tool Suite Power Visualization Power Analysis Tools Power Modeling Power Optimization Conclusion.

E N D
Power Visualization, Analysis, and Optimization Tools for FPGAs Matthew French, Li Wang and Michael Wirthlin USC, Information Sciences Institute, BYU
Outline • Introduction • Background • JDHL Tool Suite • Power Visualization • Power Analysis Tools • Power Modeling • Power Optimization • Conclusion
Introduction • Many devices demand low power in order to increase functional lifetime • CLBs max operating frequency rapidly (exponentially) increasing • Operating voltages decreasing much slower • Result: Exponentially increasing maximum power consumption per device
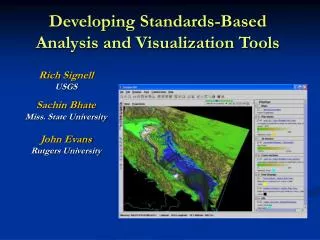
Low-Power Intelligent Tool Environment • Object oriented tool set for Power Visualization via JHDL • Uses: • Circuit logic • FPGA architecture • Power information
LITE • Take models and power analysis tools and create a power optimization algorithm • Algorithm development is supported through the user of tools to query and sort circuit characteristics and drop in COTS CAD tool compliant constraints.
Background • Low Power FPGA Designs • Address VLSI designs of FPGAs • Synthesis-Level power optimizations • Mapping to LUT-based FPGA techniques • Reduce glitching power through pipelining • CAD algorithms for PAR
Background • Offer “point” solutions • Little user control / feedback • Synthesis - PAR optimized for Speed / Area • Current tools limited • Readability • Entry point in FPGA design flow • Current estimates: • Manually estimating
FPGA’s in Low Power Environments Three Needs: • Monitor power consumption early in design process • Captures data-dependent transients and overall power consumption • Perform real-time constrain-driven automated power optimizations like the Area / Timing constraints are done today
JHDL Tool Suite • JHDL Background • EDIF Import Parser • Cross Tool Naming and Correlation
JHDL Background • Create complex, high speed FPGA circuit modules programmatically from within Java. • Design Aids: • Digital circuit simulator • Circuit hierarchy browser • FPGA library primitives • Tools for exporting to EDIF and VHDL
JHDL / LITE • Interoperation with existing commercial tool flows based on an HDL, through seemless JHDL-EDIF translation. • Single user interface • GUI event API developed • New tools to fully interact with JHDL
EDIF Import Parser • Development of new EDIF netlist tool • Developed independently from JDHL • Supports parsing of large EDIF netlists / merge multiple EDIF files • JHDL export feature added • EDIF Parser provides LITE tool suite • Capability to import 3rd party FPGA design • Provides consistent circuit database
Cross Tool Naming Correlation • Ability to correlate design resources between: • EDIF, JHDL, LITE, COTS PAR tool flow • Difficulty: Different vendor specific names and JHDL simulation interpret names • “Original” (Xilinx) • “Valid” (JHDL) • Added Name management resource
Power Visualization • Tree-view of circuit and shows cumulative power consumption of each module in circuit • Sorted by power consumption • Plot of instantaneous power history of selected cells over time • Focuses on power modes / operating modes • Identify and characterize modes for different scenarios (Temporal view)
Figure 4 modes power
Power Visualization • Simulation uses capacitance values: • Post PAR via Xilinx’s XPower • Pre PAR via Power Modeling • A variety of modeling algorithms can be used • Simulator work with design during both Pre and Post PAR = more accurate modeling with a fully routed design
Power Analysis Tools • XDL Importer • Detailed information of how a circuit was mapped, placed, and routed to be captured by JHDL environment • XPR Importer • Capture Xilinx’s XPower outputs • Post PAR circuit modeling • Create capacitance libraries of components and interconnect capacitance values
Power Analysis Tools • Two types of plots to visualize and verify power and architectural mapping correlations. • Interconnect Histogram • Number of each interconnect resources • Long Lines, Direct Connections, Double Lines, Hexagonal Lines, Programmable Interconnect Points • Net Characteristic Plot • Plot capacitance vs. net length, number of PIPs, or number of loads for every net in the diagram
Power Modeling • Move power considerations to front of tool flow • Accurate models required to estimate and predict power consumption • Power Analysis tool: • Synthesized circuit compared to PAR • Allows development and experimentation of power models • Toggle rate only • Exact timing-level PAR circuit
Power Modeling • Lite exploits extensible JHDL data types • Representing hierarchical structure and connectivity of circuits of a FPGA • Data types augmented with load estimates for each net and cell • Dynamic power consumption
Power Modeling • Capacitance • FPGA logic resource • Published / extracted from Xpower reports • Interconnect route resource drives • Most difficult to model • Unknown until PAR • Fanout = strong predictor of net capacitance • 80% accuracy predicting where nets would be mapped • 3.2% mean power prediction error • 1.2% standard deviation
Power Optimization • Specifically - Routing and interconnect power dissipation • 50-70% of FPGA dynamic power consumption is dissipated in clocking and interconnection network • Will not functionally alter user’s design • Future: EDIF Parser does provide API for synthesis level circuit mapping modifications which could be incorporated into power mapping API
Power Optimization • Allows user to combine COTS CAD tool constraints (timing and placement) with results from Power Analysis to meet designer’s needs.
Clock Table • Clock Table similar in appearance and capabilities but is tailored for clock analysis. • Toggle Rate • Number of sink flip-flops • Capacitance • Power consumption
Power Optimization Algorithms • Slack minimization • Compares combinational logic delay of a net with its timing specification • Tightens the timing constraints on nets with the potential for long interconnects • Clock tree minimization • Place logic close to “trunk” of clock distribution tree
Power Optimization Algorithms • 2-terminal net co-location • Placing unity fanout signals tightly to use direct connects or internal slice routing • Area minimization • Balance clock tree paring with West - East signal routing (Virtex architecture)
Results (?) • Combine power optimization techniques • average dynamic power reduction 10.2% • peak reduction power reduction 19.4%
Conclusion • Introduces LITE • Uses JHDL to address: • Power visualization • Power consumption logic level tree view • Power analysis • Interacts with COTS CAD tools • Power optimization algorithms • Elevate level of abstraction closer to design entry point