Download
1 / 40
400 likes | 480 Views
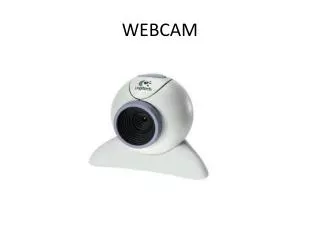
Visualization Tools For Webcam Scenes. A Masters Project by David Ross Friday, May 24, 2009 . With slides by Nathan Jacobs and Robert Pless. Acknowledgement. Advisor: Professor Robert Pless Committee: Professor Tao Ju Professor Bill Smart M&M Lab: Nathan Jacobs Michael Dixon

E N D
Visualization Tools ForWebcam Scenes A Masters Project by David Ross Friday, May 24, 2009 With slides by Nathan Jacobs and Robert Pless
Acknowledgement • Advisor: • Professor Robert Pless • Committee: • Professor Tao Ju • Professor Bill Smart • M&M Lab: • Nathan Jacobs • Michael Dixon • and others
Overview • Introduction • Webcams and the AMOS Dataset • Problem Motivation • Principal Component Analysis (PCA) • Visualization Tools • PCA Input • Visualization • Evaluations • Conclusion • Future Work
Introduction • Given a static webcam scene, how can we make it easier to understand the variation in the scene? • Automatic visualization tools to quickly show interesting variation • Why? Help to maintain and understand massive AMOS Dataset • Use PCA to learn less interesting variation, analyze PCA error to find more interesting variation
“Interesting” Variation • Outdoor scenes vary naturally and predictably • Day/night • Weather • Seasonal • Unnatural variation less predictable • People, cars, other objects • Camera/image variation • Scene changes • To understand a scene is to understand the latter
The Archive of Many Outdoor Scenes (AMOS) • Images from ~1000 static webcams, • Every 30 minutes since March 2006. • http://amos.cse.wustl.edu • Capture variations from fixed cameras • Due to lighting (time of day), and • Seasonal and weather variations (over a year). • From cameras mostly in the USA (a few elsewhere). AMOS Dataset
3000 webcams x 1 years 35 million images AMOS Dataset Variations over a year and over a day
PCA is a method used to extract the most significant features from given dataset • Given a set of images I and a number k>0, finds the k most important features in the set of images • [U S V] = PCA(I,k) • U contains the k feature, or basis, images, all of which are orthogonal to each other • S is a diagonal matrix which contains the weights of each feature vector • V contains the coefficients of each basis image for each actual image • Will extract the most significant features to minimize Principal Component Analysis (PCA)
We can reconstruct image x as a linear combination of the basis images: ix=USvx • Reconstructed images will not exactly match the original images • Similarity increases as we increase the number of coefficients k • Given a new image W we can find its coefficients • v = UTW • Residual Image or reconstruction error • Iresidual = (I – Imean) – Irecontsructed PCA D U S V coefficients = Basis Images Images
Camera 1 Camera 2 = + f1(t) + f2(t) + ... Camera 3 mean Image component 2 component 1 Camera 4
PCA – dependence on k • Image reconstruction is sensitive to k parameter • As k approaches the number of images, error decreases • 189 images, k = 0-50
Incremental PCA • Too many images to fit into memory at once • Can iteratively update our U, S, and V matrices for new images • Good estimate for U and S • V coefficient for early images not updated well for later changes to U and S • Can fix S and V on a second pass • (S * Vx)fixed= (Ix – Imean) * U
But what do we take PCA of? • Daytime images • Sky Mask • Gradient Magnitude Images
Daytime Images • Could take PCA of the entire set of images from one camera • Not interested in how image varies from day to night • Camera noise in low light • Choose only daytime images • Input images have least natural variation
Sky Mask • Sky is another source of unnatural variation • Sun, clouds, hard to model • Not what we are interested in, so why waste effort?
Sky Mask - algorithm • Luckily, we can mask it away • 1st PCA Component of most natural scenes (all times of day) is the sky • Simple thresholding can accurately segment the scene
Gradient Magnitude Images • Can take the gradient magnitude of images • Ignores changes in overall image intensity while retaining the scene structure Not that useful
How do we display results? • Image montage – show most interesting images • Highest value of some score • Well-Separated Set Montage • 2D GUI
Well-Separated Set • Image montages often have similar images • same parked cars, same crazy golf course scene • Want to show the n most interesting and unique images • Algorithm: • Pick N > n interseting images to set S • Seed with S = {most interesting image} • Iterate • Create by-pixel difference Matrix D • Choose image i that has highest distance to set S • S = {S i} • Used for all montage visualizations
2D GUI • Explore two dimensions at once (example later)
How do we evaluate images? • PCA will capture the uninteresting variation, need to analyze the error to find interesting variation • Coefficient Vector Magnitude • Reconstruction Error • Variance Model • Distribution of Residuals
PCA Coefficient Vector Magnitude • D (:,x) ~= U S V(x,:) • S * V(x,:) is a vector of dimension k corresponding to the linear combination of U columns that best approximates D(:,x) • D is mean subtracted so • ||SV(x,:)|| gives a measure of how far from the mean image is each image
Residual Error • PCA gives a reconstructed image • Iresidual = (I – Imean) – Irecontsructed • Sum of the squared residual values gives a good measure for “how much variation did we not capture”
Variance Model • Can estimate the variance image of a scene by averaging sum squared residual at each pixel across all images
Z-score Image • To find which variation is most unusual, can calculate the z-score at each pixel • Z-score(x,y) = Residual(x,y) / Variance(x,y) • Now we have a more context-based system for evaluating how interesting variation is • Most marketable contribution • security
Statistical Distribution of Residual Images • Can treat R(x,y) as a sample from an underlying PDF • Expect noise to be Gaussian, objects to be non-Gaussian
Normal Distribution • If we expect R(x,y) to sample from a normal distribution, we can easy estimate that and then evaluate each value using
Laplacian Distribution • Many histograms look more like Laplacian Distributions, so we can do the same algorithm but for the Laplacian distribution
Bonus – Skewness and Kurtosis • Statistics for “non-Guassiannesss” • Skewness measures asymmetry • No good results • Kurtosis measures unlikely deviation • Tends to mirror the residual sum squared error scores • The effect of small objects is dominated by the noise over the rest of the image
Conclusion • AMOS Dataset too big to keep track of interesting variation in each scene • Developed automatic visualization tools to help • Use PCA to learn less interesting variation • Daytime images, sky mask -> useful • Gradient images -> not useful • Interesting images from evaluating PCA error • Reconstruction error and Variance Models -> useful • Statistical models -> mixed results
Future Work • Interface with AMOS site • Object Extraction • User customizability