Download
1 / 20
200 likes | 360 Views
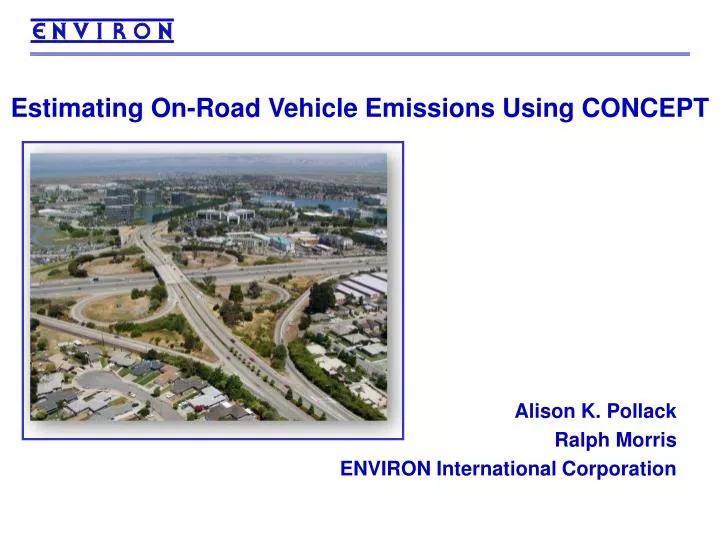
Estimating On-Road Vehicle Emissions Using CONCEPT. Alison K. Pollack Ralph Morris ENVIRON International Corporation. Overview. WRAP On-Road Emissions Estimates for Regional Haze Modeling CONCEPT Overview CONCEPT MV Inputs Required CONCEPT MV Emissions Approach & Steps

E N D
Estimating On-Road Vehicle Emissions Using CONCEPT Alison K. Pollack Ralph Morris ENVIRON International Corporation .
Overview • WRAP On-Road Emissions Estimates for Regional Haze Modeling • CONCEPT Overview • CONCEPT MV Inputs Required • CONCEPT MV Emissions Approach & Steps • Summary of Key Differences Between SMOKE and CONCEPT MV • Denver Example Application and comparison of SMOKE vs CONCEPT approaches
Local Parameters Temperature Fuel Specifications Control Programs Vehicle Registration On-Road Mobile Emissions Estimates -General Approach MOBILE6.2 Generates g/mi Emission Factors Local Travel Data Vehicle Miles Traveled (VMT) and Speed by Roadway Type VMT Growth Rates = X Emissions
WRAP On-Road Emissions Estimates(2002, 2008, 2013, 2018) • Regionally consistent estimation methods • Surveyed State/Local Agencies for Most Up-to-Date Detailed Inputs • 2002 Base year inputs and VMT • Future year inputs, VMT growth • Unpaved road VMT • Responses were received from all state agencies and key local agencies • Estimated County-level Emissions • Emissions Were Processed Using SMOKE • Spatial allocation using Census TIGER roadway mileage • Temporal allocation of emissions using temporal profiles for activity data
CONCEPT vs. SMOKE for On-Road Mobile • SMOKE • Emissions are estimated using county-level activity data • Can use day/hour-specific county average • Useful for areas where detailed link data are not available • CONCEPT MV • Estimates emissions based on detailed link-based activity data (VMT and speed) from a Traffic Demand Model • Uses day-specific, grid cell-specific meteorological data • Highly resolved temporal and spatial variation of VMT and fleet mix
CONCEPT Overview • Consolidated Community Emissions Processing Tool • Open Source • Freely Available • Database Management System • Community Support & Enhancements • Balances Transparency/QA and Performance/Integration with GIS/Spatial Tools • Quality Assurance – Intermediate Tables Output • Includes all Emissions Source Categories • Point, Area, On/Off-Road Mobile, Biogenics • Performs same emissions processing as SMOKE • Temporal and Spatial Allocation, CEM Emissions Processing, Speciation, Growth & Control • Motor Vehicle (MV) Module Estimates Highly Detailed On-Road Vehicle Emissions
CONCEPT MV • Uses output from transportation demand models (TDM) • Generates gridded, hourly link-level emissions by vehicle class • Uses 8 MOBILE5 vehicle classes • Detailed temporal resolution of traffic volume, speeds, and VMT mix • Uses day/hour-specific gridded met data • Stores many intermediate emissions tables for QA and data review
TDM Link Inputs to CONCEPT MV • Endpoint coordinates and projection definition • Volume and capacity • Typically provided for multi-hour periods for typical weekday, e.g. am peak, midday, pm peak, overnight • Speeds • Generally free flow speeds are provided • Congested speed is calculated from free flow speed and volume/capacity ratio for each hour • Roadway type • MOBILE6 has different emission factors by roadway type
CONCEPT Temporal Allocation • CONCEPT disaggregates link data (volume, capacities) for multi-hour periods into hourly volumes and capacities • Requires hourly total volume profiles by roadway type, month, day of week • Total volume temporal profiles are developed from analysis of local area automated traffic recorder (ATR) data (available from State DOTs)
CONCEPT Vehicle Mix Disaggregation • TDM link volumes are generally total across all vehicle classes • CONCEPT disaggregates total volume into eight MOBILE5 vehicle classes • Requires hourly VMT mix profiles by roadway type, month, day of week, hour of day • VMT mix temporal profiles are developed from analysis of local area vehicle classification recorder data
Denver Example Vehicle Mix Temporal Profile HDDV VMT fraction is lower during am and pm peak traffic hours
CONCEPT MV Steps in Estimation of On-Road Motor Vehicle Emissions • Temporally allocate VMT to hours • Adjust free flow speeds for congestion • Spatially allocate links to grid cells • Allocate total VMT to 8 MOBILE5 vehicle classes • Run MOBILE6 with grid-specific meteorology • Apply MOBILE6 emission factors using county inputs for fuel parameters and control programs • Speciate emissions for air quality modeling
Summary of CONCEPT vs. SMOKE Methods for On-Road Mobile Emissions
Spatial Distribution of VMT for Grid Modeling is Very Different When Link VMT is Used Max VMT = 301 Max VMT = 89 County-level VMT gridded to km Allocation based on Census TIGER roadway surrogates; creates VMT “hot spots” Link VMT gridded to 1km VMT distributed across more roads – more detailed spatial coverage
Improved Denver Ozone Performance using CONCEPT MV Link-Based Emissions • Denver 8-hour ozone Early Action Compact (EAC) SIP (2002-2003) allocated county-level mobile emissions using Census TIGER roadways surrogates • Ozone suppressed in Denver metropolitan area every day of the episode leading to underprediction bias • New Denver 8-hour ozone SIP modeling using CONCEPT MV to generate spatially and temporally highly resolved inventory does not exhibit such a large ozone hole • Better distinguishes weekend effect when high ozone occurs in metropolitan Denver
Example 8-h ozone model performance from Denver 8-h ozone EAC SIP modeling Ozone “hole” occurs every day Modeled ozone “hole” in metropolitan Denver of 55-60 ppb ozone where some observed values > 70 ppb
Example 8-h ozone model performance for new Denver SIP modeling using CONCEPT MV (Saturday) Model now able to reproduce high ozone in metropolitan Denver
CONCEPT MV Regional Application: 22 State and Local Networks in LADCO Domain