Download
1 / 20
200 likes | 314 Views
Estimating Emissions for the 2008 Evans Road Fire in North Carolina. George Pouliot, Ana Rappold , Amber Soja , Wayne Cascio. 11 th Annual CMAS Conference, Chapel Hill NC. Office of Research and Development

E N D
Estimating Emissions for the 2008 Evans Road Fire in North Carolina George Pouliot, Ana Rappold, Amber Soja, Wayne Cascio 11th Annual CMAS Conference, Chapel Hill NC Office of Research and Development National Exposure Research Laboratory & National Health and Environmental Effects Research Laboratory October 16, 2012
SMOKE produced by Evans Road Fire Health Impacts
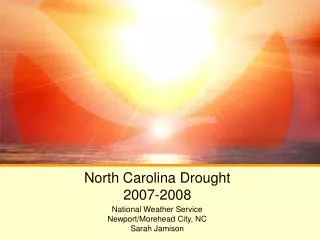
Motivation and Purpose • Evans road fire in North Carolina • Largest fire in NC in 22 years • Rich deposits of peat and poor oxygen produced extremely high levels of PM2.5 • Health and wildfire study: characterize the impacts of wildfire on community health and economy • Linking health and economic outcomes with the exposure • Accurate estimates of emissions especially PM2.5, critical for this study as input into the chemical transport model
This natural-color image from the Moderate Resolution Imaging Spectroradiometer (MODIS) on NASA’s Terra satellite on June 11, 2008, shows the fire (active locations outlined in red) and smoke over the region. Photo Credit: NASA MODIS Rapid Response Team
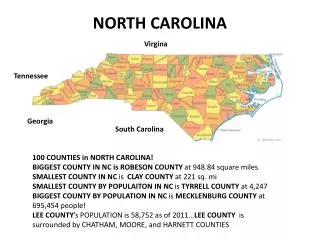
Evans Road Fire • Started June 1, 2008 by lightning in eastern NC during a prolonged drought • On June 3rd , the fire broke containment into the Pocosin Lakes National Wildlife Refuge • 40,704 acres (165 km2) of Pocosin Fuel in peatlands • Fire contained by August 7, 2008 but continued to smolder until Jan 9, 2009
Evans Road Fire • Burned up to depths of 15ft (4.5 m) • Large amounts of Carbon in peat soil released into atmosphere over several months Photo Credits: USFWS
Goal of this work • Estimate realistic emissions of PM2.5 on an hourly basis for a 12km grid cell for a 3 month simulation of CMAQ • How well does the 2008 NEI capture this fire?
National Emissions InventoryEmission Estimate • Based on Satellite detections from NOAA Hazard Mapping System • Fuel model (FCCS) and Consumption Model (CONSUME) • Total PM2.5 of 26,490 tons
Plan of Modeling Effort • 2008 NEI estimates do not characterize the smoldering component of fire very well since the fire burned below ground for most of its duration. • Use additional studies and estimates to determine the temporal, spatial, and chemical characteristics of Evans Road fire and to better characterize the organic portion of carbon emissions from smoldering
Ways to Better Characterize Emissions from Evans Road Fire • Total Carbon Estimate (place an upper limit on emissions) • Emission Factors and Speciation • Temporal Allocation • Spatial Allocation
Total Carbon Estimate:Provides an upper bound on the emissions • Mickler, Robert: Carbon Fluxes and Greenhouse Gas Emissions from Wildland Fires in the 2013 Supplement to the 2006 IPCC Guidelines for National Greenhouse Gas Inventories, 20th International Emission Inventory Conference, August 15, 2012 • Using differenced Normalized Burn Ratio (dNBR) data associated with Carbon Consumption measurements in the Fire region, carbon consumption estimates were made for the Evans Road Fire • Estimate of 9.1Tg Carbon below ground and 0.3 Tg C above ground • 97% of Carbon Emissions were below ground and 3% were above ground
Emission Factors and Speciation • Akagi, S. K., Yokelson, R. J., Wiedinmyer, C., Alvarado, M. J., Reid, J. S., Karl, T., Crounse, J. D., and Wennberg, P. O.: Emission factors for open and domestic biomass burning for use in atmospheric models, Atmos. Chem. Phys., 11, 4039-4072, doi:10.5194/acp-11-4039-2011, 2011. • Use the Supplemental tables S5 with average Emission Factors for Peat and average Tropical Evergreen Deforestation combined (97% and 3%) to get a custom emission factor for Evans Road Fire • Recommended way to get emission factors for peatland in the footnotes of Table S5 by Akagi
Emission Factors for Evans Road Fire (g/kg) Derived from table S5 in Akagi et. al.
Temporal Allocation for this study • Maintained mass balance of carbon consumption from Mickler and weighted the daily smoldering area burned emissions using ICS209 reports, fire fighter comments, daily GIS data, and changes in area burned • Estimated 140 tons of carbon/ha during early stages of fire: 6/3/08 to 6/10/08 and decreasing to 15-35 tons carbon/ha after 8/1/08
1) Daily GIS perimeter maps are used to estimate area burned and if these are not available, then ICS-209 reports are used. • (2) On the 4th day of burning, after area burned had reached >5336 ha (13,180 acres) and ground fires had been reported (“Ground Fire and Smoldering in Deep Organic Soils”) for 3 days, a smoldering area is included of 1215 ha (3000 acres). This number increased in accordance with rule #3 to 2024 ha (5000 acres) and decreased as the fire was controlled and ground reports changed. • (3) MODIS data are used to provide guidance in the minimal activity of the fire. If a day contained greater than 25 fire detections (FD), it is assumed 1417 ha (3500 acres) is the minimal area consumed (by flaming and smoldering areas; if > 50 FD, then 1619 ha (4000 acres) is consumed; if > 100 FD, then 2024 ha (5000 acres) is consumed; and if > 150 FD, then 2429 ha (6000 acres) is consumed. • (4) After June 14th, there is no appreciable burned area reported, however the fire was still substantially active (40% contained June 15th). In June, with only the guidance of the ground-based daily fire reports, between 1417 and 1822 ha (3500–4500 acres) of area is assumed to burn, primarily in smoldering peat. With only the guidance of the ground-based daily fire reports, area burned in early July is assumed to be 1417 ha and deceases to 709 ha (1750 acres); in early August 709 ha is assumed and decreases to 486 ha (1200 acres); and lastly, in early September, 486 ha is assumed burned and decreases to 405 ha (1000 acres) for most of that month Daily area burned of both flaming and smoldering based on a set of 4 hierarchical rules
Future Work • Relate carbon consumption estimates to criteria pollutants (e.g. CO emissions from carbon consumption) • Create & process emissions for CMAQ simulation • Run CMAQ for 3 scenarios • (1) Evans fire removed • (2) 2008 NEI emission estimate • (3) Revised estimate based on this work • Evaluate CMAQ model performance for three cases • Use PM2.5 Concentrations Estimates for Health Study