Download
1 / 15
150 likes | 286 Views
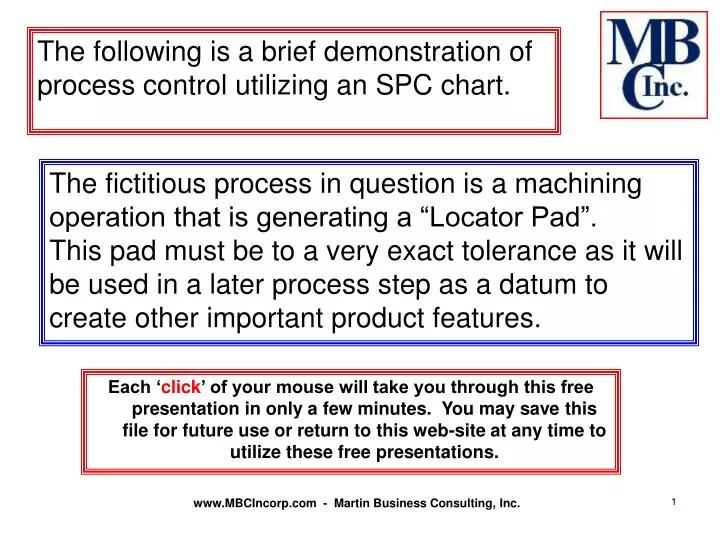
The fictitious process in question is a machining operation that is generating a “Locator Pad”. This pad must be to a very exact tolerance as it will be used in a later process step as a datum to create other important product features.

E N D
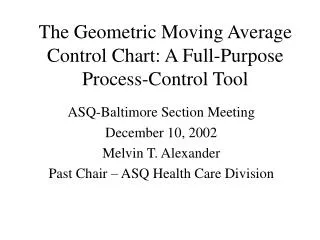
The fictitious process in question is a machining operation that is generating a “Locator Pad”. This pad must be to a very exact tolerance as it will be used in a later process step as a datum to create other important product features. The following is a brief demonstration of process control utilizing an SPC chart. Each ‘click’ of your mouse will take you through this free presentation in only a few minutes. You may save this file for future use or return to this web-site at any time to utilize these free presentations. www.MBCIncorp.com - Martin Business Consulting, Inc.
Demonstration of Process ControlMachining Operation – Locater Pad Height This top chart is a record of each part manufactured. As you proceed through this presentation each of the representative 620 manufactured parts are measured and recorded here. Hi X These two ‘dashed’ lines indicate the “control-limits” for the sub-group average. Lo This presentation is “demo” only and does not define or imply your requirements for manufacturing process control. Each application of Statistical Process Control must be independently defined and developed. This bordered chart is the SPC control chart for average and range The top portion of the SPC chart records the average of each sub-group. In this case we are measuring (5) parts for each sub-group and recording the average. UCL X LCL This ‘dashed’ line indicates the “control-limit” for the range. This lower portion of the SPC chart records the sub-group range. This plotted point is a representation of the amount of variation found within the sub-group of (5) parts. UCL R www.MBCIncorp.com - Martin Business Consulting, Inc.
Demonstration of Process ControlMachining Operation – Locater Pad Height Hi ● ● X ● ● ● Lo UCL These (5) points represent the height dimension of the first five parts produced. (this is a sub-group of five) X LCL UCL R www.MBCIncorp.com - Martin Business Consulting, Inc.
Demonstration of Process ControlMachining Operation – Locater Pad Height Hi ● ● X ● ● ● Lo The ‘X’ indicates the average dimension of the (5) parts of the first sub-group. UCL X X LCL As you can see this first sub-group indicates the process is “in-control”. With this indication we are now able to continue the manufacturing process by running additional parts. The ‘R’ indicates the range of measurements in the first sub-group. UCL R R 1 www.MBCIncorp.com - Martin Business Consulting, Inc.
Demonstration of Process ControlMachining Operation – Locater Pad Height Hi Since the process is in control and stable we are able to run the next 200 parts without additional inspection. 200 Parts ● ● ● ● ● ● ● X ● ● ● Lo UCL X X LCL UCL R R 1 www.MBCIncorp.com - Martin Business Consulting, Inc.
Demonstration of Process ControlMachining Operation – Locater Pad Height Hi ● ● ● ● ● ● ● ● ● ● X ● ● ● ● ● Lo The five blue dots are the plotted dimensions of the second sub-group. UCL X X LCL UCL R R 1 www.MBCIncorp.com - Martin Business Consulting, Inc.
Demonstration of Process ControlMachining Operation – Locater Pad Height Hi ● Before we can continue processing additional parts we must investigate this “Special-Cause” of variation. Our investigation shows a maintenance problem with hydraulic clamping pressure. The problem caused a variation in clamp pressure leading to the excessive variation of this sub-group. With the problem corrected we are now able to continue processing. ● ● ● ● ● ● ● ● ● X ● ● ● ● ● Lo The ‘X’ indicates the average dimension of the (5) parts of the second sub-group. UCL X X X Because of the excessive amount of variation in the sub-group. (see the top chart). The range is now “out-of-control” as indicated by the plotted point being above the range control limit. The ‘R’ indicates the range of measurements in the second sub-group. LCL R UCL R R 1 2 www.MBCIncorp.com - Martin Business Consulting, Inc.
Demonstration of Process ControlMachining Operation – Locater Pad Height Hi ● Having taken corrective action on this ‘special cause’ of variation the process is again in control and stable. We are now able to run the next 200 parts without additional inspection. ● 200 Parts ● ● ● ● ● ● ● ● X ● ● ● ● ● ● ● ● ● ● Lo UCL X X X LCL R UCL R R 1 2 www.MBCIncorp.com - Martin Business Consulting, Inc.
Demonstration of Process ControlMachining Operation – Locater Pad Height Hi ● ● ● ● ● ● ● ● ● ● X ● ● ● ● ● ● ● ● ● ● ● ● ● ● ● Lo The five green dots are the plotted dimensions of the third sub-group. UCL X X X LCL R UCL R R 1 2 www.MBCIncorp.com - Martin Business Consulting, Inc.
Demonstration of Process ControlMachining Operation – Locater Pad Height Hi ● ● ● ● ● ● ● ● ● ● X ● ● ● ● ● ● ● ● ● ● ● ● ● ● Again, before we can continue processing parts we must investigate the cause of this ‘out-of-control’ condition for the process ‘average’. Our investigation shows an adjustment problem with a locator that has worked its way loose. The maintenance department has made the repair. Processing can now continue for an additional 200 parts. ● Lo Notice the top chart shows the process has “drifted to the low side. This drift has cause the SPC chart to indicate an “out-of-control” condition for the process ‘average’. UCL X X X The ‘R’ represents the range of the third sub-group. LCL X The ‘X’ represents the plotted average of the third sub-group. R UCL R R R 1 2 3 www.MBCIncorp.com - Martin Business Consulting, Inc.
Demonstration of Process ControlMachining Operation – Locater Pad Height Hi ● 200 Parts ● ● ● ● ● ● ● ● ● ● ● ● ● ● X ● ● ● ● ● ● ● ● ● ● ● ● ● ● ● Lo Having taken corrective action on this ‘special cause’ of variation the process is again in control and stable. We are now able to run the next 200 parts without additional inspection. UCL X X X LCL X R UCL R R R 1 2 3 www.MBCIncorp.com - Martin Business Consulting, Inc.
Demonstration of Process ControlMachining Operation – Locater Pad Height Hi ● ● ● ● ● ● ● ● ● ● ● ● ● ● ● ● ● ● ● ● X ● ● ● ● ● ● ● ● ● ● ● ● ● ● ● Lo The five brown dots are the plotted dimensions of the fourth sub-group. UCL X X X LCL X R UCL R R R 1 2 3 www.MBCIncorp.com - Martin Business Consulting, Inc.
Demonstration of Process ControlMachining Operation – Locater Pad Height Hi ● ● ● ● With the plotting of the average and range of this last sub-group. We are able to determine that at this time the process continues to run in a stable and capable manner. No further action is required at this time. ● ● ● ● ● ● ● ● ● ● ● ● ● ● ● ● X ● ● ● ● ● ● ● ● ● ● ● ● ● ● ● Lo UCL X X X X LCL X R UCL R R R R 1 2 3 4 www.MBCIncorp.com - Martin Business Consulting, Inc.
Demonstration of Process ControlMachining Operation – Locater Pad Height We only checked 20 parts out of 6 hrs. production; but all parts are within print specification Hi USL ● Upper Specification Limit ● ● ● ● ● ● ● ● ● ● ● ● ● ● ● ● ● ● ● X ● ● ● ● Lower Specification Limit ● ● ● ● ● ● ● ● ● ● ● LSL Lo A very successful production run. The SPC chart allowed for effective and efficient control of the process. The efficiency of checking 20 parts out of the 620 parts produced and have all parts within specification is very ‘cost-effective’. Congratulations to the production team! UCL X X X X LCL X R UCL R R R R 1 2 3 4 www.MBCIncorp.com - Martin Business Consulting, Inc.
Thank you • If you need additional information, training or direction about “Statistical Process Control”. Visit our web-site www.MBCIncorp.com • Select the menu tab “Course List & Services”, or “Public Seminars” • Or just contact Martin Business Consulting, Inc. • E-mail – BMartin@MBCIncorp.com • Phone – 931-637-1446 • Check the web site often for new PowerPoint presentation on many topics of interest www.MBCIncorp.com - Martin Business Consulting, Inc.