Download
1 / 36
360 likes | 564 Views
Statistical Process Control (SPC) Graduate School of Business University of Colorado Boulder, CO 80309-0419. Professor Stephen Lawrence. Process Control Tools. Process tools assess conditions in existing processes to detect problems that require intervention in order to regain lost control.

E N D
Statistical ProcessControl (SPC) Graduate School of Business University of Colorado Boulder, CO 80309-0419 Professor Stephen Lawrence
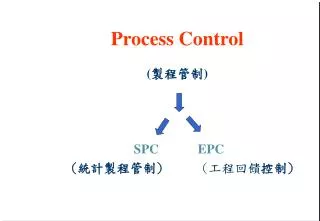
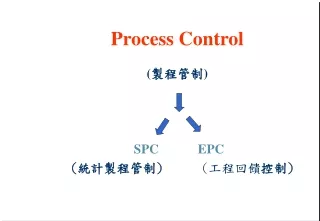
Process Control Tools • Process toolsassess conditions in existing processes to detect problems that require intervention in order to regain lost control. • Check sheets Pareto analysis • Cause & effect diagrams Scatterplots • Histograms Control charts
Order Types 7am-9am 9am-11am 11am-1pm 1pm-3pm 3pm-5-pm Emergency Nonemergency Rework Safety Stock Prototype Order Other Check Sheets • Check sheets explore what and where • an event of interest is occurring. Attribute Check Sheet 27 15 19 20 28
Run Charts measurement time
SCATTERPLOTS x x x x x x xx x x x x xx x x x x x xx x xx x x x x xx x x x x x xx x x x xx xxx x x x x xx xx x x x x xx x x x xxx xx x x x x xxx x x xx x x xx xx x x x x x xx x x xxx xx xx xxx x x xx xxx x x x x x x xx x x x x x x xx x x xx x x xx x x x Variable A Variable B
A B C D E F G H I J PARETOANALYSIS A method for identifying and separating the vital few from the trivial many. Percentage of Occurrences Factor
CPU Chip Inspection Pins not Assigned Received Defective Classification Error Defective Pins Damaged in storage Condition Procedures and Methods Maintenance Speed Training Employees Equipment CAUSE & EFFECT DIAGRAMS BAD CPU
HISTOGRAMS A statistical tool used to show the extent and type of variance within the system. Frequency of Occurrences Outcome
Special Cause Common Cause Management Employee Controlled Variation Management Management Uncontrolled Variation Deming’s Theory of Variance • Variation causes many problems for most processes • Causes of variation are either “common” or “special” • Variation can be either “controlled” or “uncontrolled” • Management is responsible for most variation Categories of Variation
Causes of Variation Process variation... What prevents perfection? • Exogenous to process • Not random • Controllable • Preventable • Examples • tool wear • “Monday” effect • poor maintenance Natural Causes Assignable Causes • Inherent to process • Random • Cannot be controlled • Cannot be prevented • Examples • weather • accuracy of measurements • capability of machine
Product Specificationand Process Variation • Product specification • desired range of product attribute • part of product design • length, weight, thickness, color, ... • nominal specification • upper and lower specification limits • Process variability • inherent variation in processes • limits what can actually be achieved • defines and limits process capability • Process may not be capable of meeting specification!
Process Capability LSL Spec USL
Process Capability • Measure of capability of process to meet (fall within) specification limits • Take “width” of process variation as 6 • If 6 < (USL - LSL), then at least 99.7% of output of process will fall within specification limits LSL Spec USL
Process Capability Ratio • If Cp > 1.0, process is... capable • If Cp < 1.0, process is... not capable Define Process Capability RatioCp as
Process Capability -- Example A manufacturer of granola bars has a weight specification 2 ounces plus or minus 0.05 ounces. If the standard deviation of the bar-making machine is 0.02 ounces, is the process capable? • USL = 2 + 0.05 = 2.05 ounces • LSL = 2 - 0.05 = 1.95 ounces • Cp = (USL - LSL) / 6 • = (2.05 - 1.95) / 6(0.02) • = 0.1 / 0.12 • = 0.85
Process Centering LSL Spec USL
LSL=1.95 2.0 USL=2.05 Process Centering -- Example For the granola bar manufacturer, if the process is incorrectly centered at 2.05 instead of 2.00 ounces, what fraction of bars will be out of specification? Out of spec! _____ of production will be out of specification!
Process Capability Index Cpk Std dev • If Cpk > 1.0, process is... Centered & capable • If Cpk < 1.0, process is... Not centered &/or not capable Meanm
Process Capability Index -- Example A manufacturer of granola bars has a weight specification 2 ounces plus or minus 0.05 ounces. If the standard deviation of the bar-making machine is s = 0.02 ounces and the process mean is m = 2.01, what is the process capability index? • USL = 2.05 oz LSL = 1.95 ounces • Cpk = min[(m -LSL) / 3 , (USL- m) / 3 ] • = min[(2.01–1.95) / 0.06 , (2.05 – 2.01) / 0.06] • = min[1.0 , 0.67] • = 0.67 Therefore, the process is not capableand/or not centered !
Process Control Charts Statistical technique for tracking a process and determining if it is going “out to control” • Establishcapabilityof process under normal conditions • Use normal process as benchmark to statistically identify abnormal process behavior • Correct process when signs of abnormal performance first begin to appear • Control the process rather than inspect the product!
Process Control Charts Upper Spec Limit Upper Control Limit 6 Target Spec 3 Lower Control Limit Lower Spec Limit
Process Control Charts UCL Target LCL Time
When to Take Action • A single point goes beyond control limits (above or below) • Two consecutive points are near the same limit (above or below) • A run of 5 points above or below the process mean • Five or more points trending toward either limit • A sharp change in level • Other erratic behavior
Types of Control Charts • Attribute control charts • monitors frequency (proportion) of defectives • p - charts • Defects control charts • monitors number (count) of defects per unit • c – charts • Variable control charts • monitors continuous variables • x-bar and R charts
1. Attribute Control Charts • p - charts • Estimate and control the frequency of defects in a population • Examples • Invoices with error s (accounting) • Incorrect account numbers (banking) • Mal-shaped pretzels (food processing) • Defective components (electronics) • Any product with “good/not good” distinctions
Using p-charts • Find long-run proportion defective (p-bar) when the process is in control. • Select a standard sample size n • Determine control limits
2. Defect Control Charts • c-charts • Estimate & control the number of defects per unit • Examples • Defects per square yard of fabric • Crimes in a neighborhood • Potholes per mile of road • Bad bytes per packet • Most often used with continuous process (vs. batch)
Using c-charts • Find long-run proportion defective (c-bar) when the process is in control. • Determine control limits
3. Control Charts for Variables • x-bar and R charts • Monitor the condition or state of continuously variable processes • Use to control continuous variables • Length, weight, hardness, acidity, electrical resistance • Examples • Weight of a box of corn flakes (food processing) • Departmental budget variances (accounting • Length of wait for service (retailing) • Thickness of paper leaving a paper-making machine
x-bar and R charts • Two things can go wrong • process mean goes out of control • process variability goes out of control • Two control solutions • X-bar charts for mean • R charts for variability
Mean not Centered Increased Variability Problems with Continuous Variables “Natural” Process Distribution Target
Range (R) Chart • Choose sample size n • Determine average in-control sample ranges R-bar where R=max-min • Construct R-chart with limits:
Mean (x-bar) Chart • Choose sample size n (same as for R-charts) • Determine average of in-control sample means (x-double-bar) • x-bar = sample mean • k = number of observations of n samples • Construct x-bar-chart with limits:
When to Take Action • A single point goes beyond control limits (above or below) • Two consecutive points are near the same limit (above or below) • A run of 5 points above or below the process mean • Five or more points trending toward either limit • A sharp change in level • Other erratic behavior
Control Chart Error Trade-offs • Setting control limits too tight (e.g., ± 2) means that normal variation will often be mistaken as an out-of-control condition (Type I error). • Setting control limits too loose (e.g., ± 4) means that an out-of-control condition will be mistaken as normal variation (Type II error). • Using control limits works well to balance Type I and Type II errors in many circumstances.