Download
1 / 1
10 likes | 72 Views
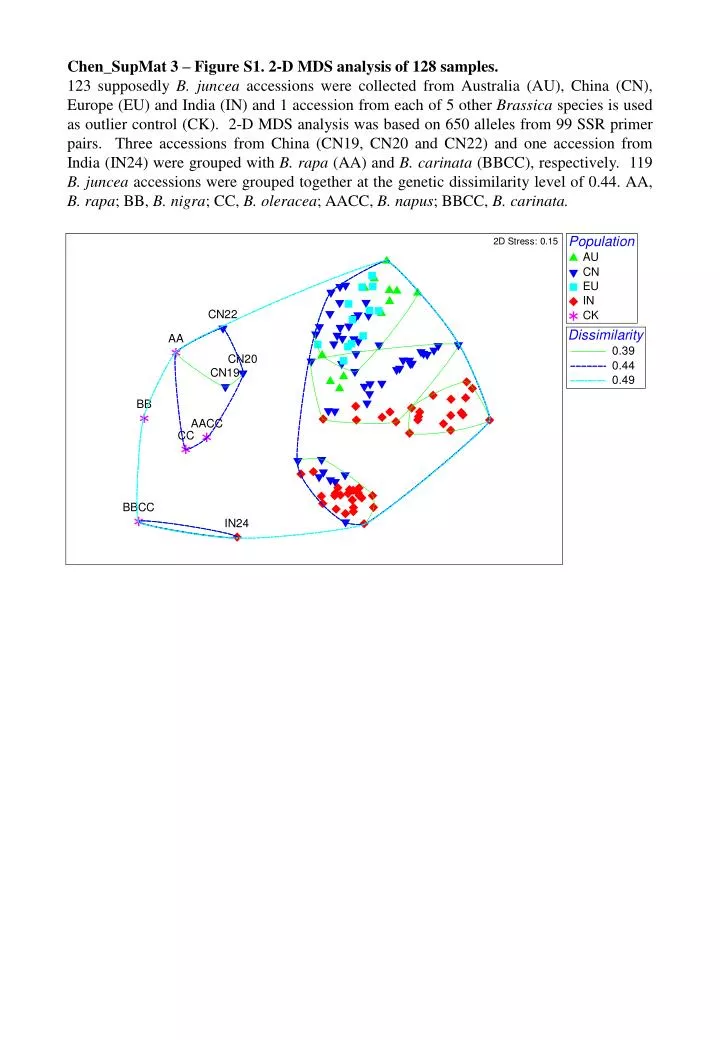
Chen_SupMat 3 – Figure S1. 2-D MDS analysis of 128 samples.

E N D
Chen_SupMat3 – Figure S1. 2-D MDS analysis of 128 samples. 123 supposedly B. juncea accessions were collected from Australia (AU), China (CN), Europe (EU) and India (IN) and 1 accession from each of 5 other Brassica species is used as outlier control (CK). 2-D MDS analysis was based on 650 alleles from 99 SSR primer pairs. Three accessions from China (CN19, CN20 and CN22) and one accession from India (IN24) were grouped with B. rapa (AA) and B. carinata (BBCC), respectively. 119 B. juncea accessions were grouped together at the genetic dissimilarity level of 0.44. AA, B. rapa; BB, B. nigra; CC, B. oleracea; AACC, B. napus; BBCC, B. carinata.