Download
1 / 1
10 likes | 114 Views
2005. 2006. 2007. 2008. Figure 2. Comparison of summer average CFU per transect from 2004 to 2007 during wet and dry days (n=4 years x 6 samples x 74 GPS points). Figure 1 . Microcosm design showing raised lid to slow rate of desiccation.

E N D
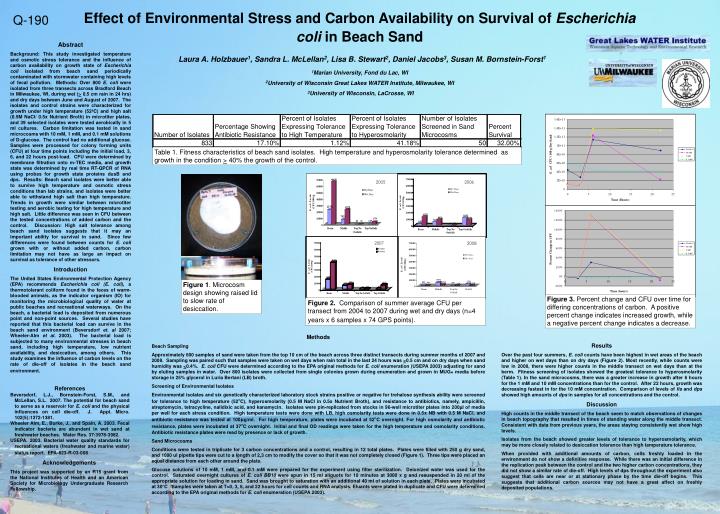
2005 2006 2007 2008 Figure 2. Comparison of summer average CFU per transect from 2004 to 2007 during wet and dry days (n=4 years x 6 samples x 74 GPS points). Figure 1. Microcosm design showing raised lid to slow rate of desiccation. Figure 3. Percent change and CFU over time for differing concentrations of carbon. A positive percent change indicates increased growth, while a negative percent change indicates a decrease. Table 1. Fitness characteristics of beach sand isolates. High temperature and hyperosmolarity tolerance determined as growth in the condition > 40% the growth of the control. Effect of Environmental Stress and Carbon Availability on Survival of Escherichia coli in Beach SandLaura A. Holzbauer1, Sandra L. McLellan2, Lisa B. Stewart2, Daniel Jacobs3, Susan M. Bornstein-Forst1 1Marian University, Fond du Lac, WI 2University of Wisconsin Great Lakes WATER Institute, Milwaukee, WI 3University of Wisconsin, LaCrosse, WI Q-190 Abstract Background: This study investigated temperature and osmotic stress tolerance and the influence of carbon availability on growth state of Escherichia coli isolated from beach sand periodically contaminated with stormwater containing high levels of fecal pollution. Methods: Over 800 E. coli were isolated from three transects across Bradford Beach in Milwaukee, WI, during wet (> 0.5 cm rain in 24 hrs) and dry days between June and August of 2007. The isolates and control strains were characterized for growth under high temperature (52ºC) and high salt (0.5M NaCl/ 0.5x Nutrient Broth) in microtiter plates, and 39 selected isolates were tested aerobically in 5 ml cultures. Carbon limitation was tested in sand microcosms with 10 mM, 1 mM, and 0.1 mM solutions of D-glucose. The control had no additional glucose. Samples were processed for colony forming units (CFU) at four time points including the initial load, 3, 6, and 22 hours post-load. CFU were determined by membrane filtration onto m-TEC media, and growth state was determined by real time RT-QPCR of RNA using probes for growth state proteins dusB and dps. Results: Beach sand isolates were better able to survive high temperature and osmotic stress conditions than lab strains, and isolates were better able to withstand high salt than high temperature. Trends in growth were similar between microtiter testing and aerobic testing for high temperature and high salt. Little difference was seen in CFU between the tested concentrations of added carbon and the control. Discussion: High salt tolerance among beach sand isolates suggests that it may an important ability for survival in sand. Since few differences were found between counts for E. coli grown with or without added carbon, carbon limitation may not have as large an impact on survival as tolerance of other stressors. Introduction The United States Environmental Protection Agency (EPA) recommends Escherichia coli (E. coli), a thermotolerant coliform found in the feces of warm-blooded animals, as the indicator organism (IO) for monitoring the microbiological quality of water at public beaches and recreational waterways. On the beach, a bacterial load is deposited from numerous point and non-point sources. Several studies have reported that this bacterial load can survive in the beach sand environment (Beversdorf et. al 2007; Wheeler-Alm et al. 2003). The bacterial load is subjected to many environmental stresses in beach sand, including high temperature, low nutrient availability, and desiccation, among others. This study examines the influence of carbon levels on the rate of die-off of isolates in the beach sand environment. Methods Beach Sampling Approximately 600 samples of sand were taken from the top 10 cm of the beach across three distinct transects during summer months of 2007 and 2008. Sampling was paired such that samples were taken on wet days when rain total in the last 24 hours was >0.5 cm and on dry days when sand humidity was <0.4%. E. coli CFU were determined according to the EPA original methods for E. coli enumeration (USEPA 2003) adjusting for sand by eluting samples in water. Over 800 isolates were collected from single colonies grown during enumeration and grown in MUG+ media before storage in 25% glycerol in Luria Bertani (LB) broth. Screening of Environmental Isolates Environmental isolates and six genetically characterized laboratory stock strains positive or negative for trehalose synthesis ability were screened for tolerance to high temperature (52ºC), hyperosmolarity (0.5 M NaCl in 0.5x Nutrient Broth), and resistance to antibiotics, namely, ampicillin, streptomycin, tetracycline, nalidixic acid, and kanamycin. Isolates were pin-replicated from stocks in 96-well microtiter plates into 200µl of media per well for each stress condition. High temperature tests were done with LB, high osmolarity tests were done in 0.5x NB with 0.5 M NaCl, and antibiotic resistance was tested at 100µg/ml. For high temperature, plates were incubated at 52ºC overnight. For high osmolarity and antibiotic resistance, plates were incubated at 37ºC overnight. Initial and final OD readings were taken for the high temperature and osmolarity conditions. Antibiotic resistance plates were read by presence or lack of growth. Sand Microcosms Conditions were tested in triplicate for 3 carbon concentrations and a control, resulting in 12 total plates. Plates were filled with 250 g dry sand, and 1000 ul pipette tips were cut to a length of 2.3 cm to modify the cover so that it was not completely closed (Figure 1). Three tips were placed an equal distance from each other around the plate. Glucose solutions of 10 mM, 1 mM, and 0.1 mM were prepared for the experiment using filter sterilization. Deionized water was used for the control. Saturated overnight cultures of E. coli BB10 were spun in 15 ml aliquots for 10 minutes at 3000 x g and resuspended in 20 ml of the appropriate solution for loading in sand. Sand was brought to saturation with an additional 40 ml of solution in each plate. Plates were incubated at 30°C. Samples were taken at T=0, 3, 6, and 22 hours for cell counts and RNA analysis. Eluants were plated in duplicate and CFU were determined according to the EPA original methods for E. coli enumeration (USEPA 2003). Results Over the past four summers, E. coli counts have been highest in wet areas of the beach and higher on wet days than on dry days (Figure 2). Most recently, while counts were low in 2008, there were higher counts in the middle transect on wet days than at the berm. Fitness screening of isolates showed the greatest tolerance to hyperosmolarity (Table 1). In the sand microcosms, there was a greater increase in growth after 6 hours for the 1 mM and 10 mM concentrations than for the control. After 22 hours, growth was decreasing fastest in for the 10 mM concentration. Comparison of levels of fis and dps showed high amounts of dps in samples for all concentrations and the control. Discussion High counts in the middle transect of the beach seem to match observations of changes in beach topography that resulted in times of standing water along the middle transect. Consistent with data from previous years, the areas staying consistently wet show high levels. Isolates from the beach showed greater levels of tolerance to hyperosmolarity, which may be more closely related to desiccation tolerance than high temperature tolerance. When provided with additional amounts of carbon, cells freshly loaded in the environment do not show a definitive response. While there was an initial difference in the replication peak between the control and the two higher carbon concentrations, they did not show a similar rate of die-off. High levels of dps throughout the experiment also suggest that cells are near or at stationary phase by the time die-off begins. This suggests that additional carbon sources may not have a great affect on freshly deposited populations. References Beversdorf, L.J., Bornstein-Forst, S.M., and McLellan, S.L. 2007. The potential for beach sand to serve as a reservoir for E. coli and the physical influences on cell die-off. J. Appl. Micro. 102(5):1372-1381. Wheeler Alm, E., Burke, J., and Spain, A. 2003. Fecal indicator bacteria are abundant in wet sand at freshwater beaches. Water Res. 37:3978-3982. USEPA. 2003. Bacterial water quality standards for recreational waters (freshwater and marine water) status report. EPA-823-R-03-008 Acknowledgements This project was supported by an R15 grant from the National Institutes of Health and an American Society for Microbiology Undergraduate Research Fellowship.