Download
1 / 18
180 likes | 311 Views
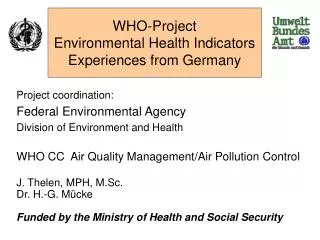
Environmental Health Indicators experiences from the Czech Republic. Růžena Kubínová Vladimíra Puklová National Institute of Public Health Prague. Content of the report.

E N D
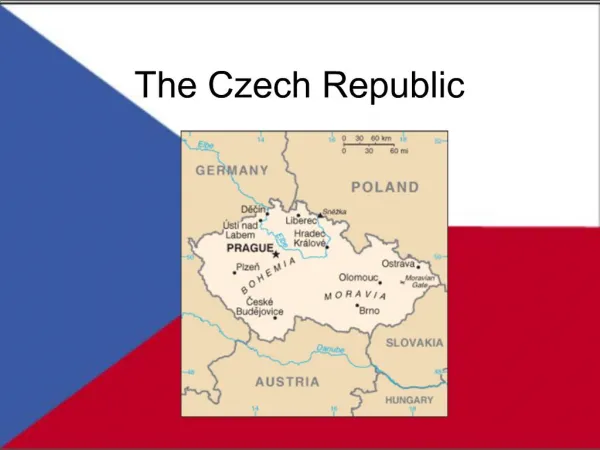
Environmental Health Indicatorsexperiences from the Czech Republic Růžena Kubínová Vladimíra Puklová National Institute of Public Health Prague
Content of the report • What is common and what is different in the established EH Monitoring System in CR and in EH Information System for WHO European Region • The benefits of the new implemented EH Information System for public health decision sphere • Experiences from bringing the indicator data together • The main task for the near future • Some outputs from the EH indicators monitoring
Public Health Service 1994 by the Governmental Order Environmental Health Monitoring System established in 30 cities (over 3 mil. inhabitants) • air pollution and health • drinking water pollution and health • diet and health • upper soil pollution in childrens’ playgrounds • pollutant and benefit elem. levels in human organism • ambient noise and health • health status questionnaire and health statistics • register of occupational diseases • register of occupational exposures by category • register of occupational exposures to carcinogens new
State, exposure and effect ind. : -air pollution level and potential exposure to basic airborne pollutants -drinking water and dietary contaminant exposures with their health effects (infections and intoxications) -professional diseases incidence Driving force ind.: Fuel consumption Pressure ind.: Emissions of air pollutants Hazardous waste generation Waste water treatment coverage Traffic ind. Housing ind. Radiation ind. Chemical emergencies ind. Action ind. Specif. contaminants monitoring: PAHs, VOCs and metals in PM Mutagenicity of PM Specific health ind.: Allergy prevalence in children Acute resp. diseases Health complaints in mid-age Contaminant levels in blood, urine, breast milk Urban upper soil pollution EHIS for WHO European region EH Monitoring System
BENEFITS OF PROPOSED EH INDICATORS FOR THE WHO EUROPEAN REGION • Once again wider insight after changing of the activities range • International comparison of relevant indicators • AVAILABILITY OF THE INDICATORS • With some exceptions the proposed indicators are available within the activities of Environmental, Health, Agricultural, Traffic and other departments and institutions • In all, the data have been provided by 13 national institutions
ADVANTAGES BY DATA COLLECTING • Good tradition in reporting - annual reports and notifications for decision-making and management authorities • Accession process to EU brings harmonization to monitoring and reporting requests and methods • DIFFICULTIES AT PROJECT IMPLEMENTING • Not enough willingness of the data holders to put through the methodological changes according to WHO proposed methodology for certain indicators • The low readiness to pay adequate attention to this system as the data holders feel loaded by numbers of reporting systems, associated with environment and sustainable life, containing similar indicators
THE MAIN TASK • to implement a simple, functionalinformation flow system from data holders to the EHI database
+ over 3x exceeding of daily limit + over 35x exceeding of daily limit
Allergy prevalence in children The survey was conducted in 18 cities
Structure of allergic diseases in children, 2001 The quotient of children (5, 9, 13, 17 years of age) with allergy was 25 %