Download
1 / 45
470 likes | 707 Views
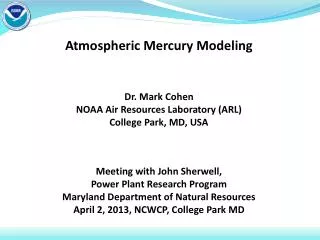
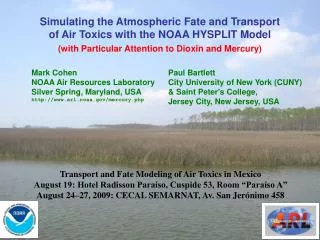
Simulations of Atmospheric Mercury with the NOAA HYSPLIT Model. Mark Cohen, Roland Draxler, Winston Luke, Paul Kelley, and Richard Artz NOAA Air Resources Laboratory, Silver Spring, MD, http://www.arl.noaa.gov/mercury.php. In collaboration with

E N D
Simulations of Atmospheric Mercury with the NOAA HYSPLIT Model Mark Cohen, Roland Draxler, Winston Luke, Paul Kelley, and Richard Artz NOAA Air Resources Laboratory, Silver Spring, MD, http://www.arl.noaa.gov/mercury.php In collaboration with Anjaneyulu Yerramilli, Jerzy Leszczynski, Hari Dasari, Rao V.B. Dodla, Chuck Patrick, Robert Hughes, Julius Baham, Shelton Swanier, and other colleagues at Jackson State University Symposium on Atmospheric Modeling and Application of GIS and Scientific Visualization Technologies for Risk Assessment July 30-31, 2009, Jackson State University
Public Health Context • Methyl-mercury is a developmental neurotoxin -- risks to fetuses/infants • Cardiovascular toxicity might be even more significant (CRS, 2005) • Critical exposure pathway: methylmercury from fish consumption • Widespread fish consumption advisories • Uncertainties, but mercury toxicity relatively well understood • well-documented tragedies: (a) Minimata (Japan) ~1930 to ~1970; (b) Basra (Iraq), 1971 • epidemiological studies, e.g., (a) Seychelles; (b) Faroe Islands; (c) New Zealand • methylmercury vs. Omega-III Fatty Acids • selenium – protective role? • At current exposures, risk to large numbers of fetuses/infants + Wildlife Health Issues e.g., fish-eating birds
Different “forms” of mercury in the atmosphere • Elemental Mercury -- Hg(0) • most of total Hg in atmosphere • not very water soluble • doesn’t easily dry or wet deposit • upward evasion vs. deposition • atmos. lifetime approx ~ 0.5-1 yr • globally distributed Atmospheric methyl-mercury? • Reactive Gaseous Mercury -- RGM • a few percent of total atmos Hg • oxidized Hg (HgCl2, others) • operationally defined • very water soluble and “sticky” • atmos. lifetime <= 1 week • local and regional effects • bioavailable • Particulate Mercury -- Hg(p) • a few percent of total atmos Hg • not pure particles of mercury • Hg compounds in/on atmos particles • species largely unknown (HgO?) • atmos. lifetime approx 1~ 2 weeks • local and regional effects • bioavailability?
Hg from other sources: local, regional & more distant Reactive halogens in marine boundary layer emissions of Hg(0), Hg(II), Hg(p) • Enhanced oxidation of Hg(0) to RGM • Enhanced deposition wet and dry deposition to the watershed wet and dry deposition to the water surface Source Attribution for Deposition?
size/shape of symbol denotes amount of mercury emitted (kg/yr) 5 - 10 10 - 50 50 - 100 100 – 300 300 - 500 500 - 1000 1000 - 3500 color of symbol denotes type of mercury source coal-fired power plants other fuel combustion waste incineration metallurgical manufacturing & other Elemental Mercury -- Hg(0) -- Emissions to the Air 2002 U.S. data from USEPA National Emissions Inventory (NEI); 2002 Canadian data from Environment Canada; 1999 Mexican data from inventory prepared by Acosta y Asociados for the Commission for Environmental Cooperation
size/shape of symbol denotes amount of mercury emitted (kg/yr) 5 - 10 10 - 50 50 - 100 100 – 300 300 - 500 500 - 1000 1000 - 3500 color of symbol denotes type of mercury source coal-fired power plants other fuel combustion waste incineration metallurgical manufacturing & other Reactive Gaseous Mercury – RGM -- Emissions to the Air 2002 U.S. data from USEPA National Emissions Inventory (NEI); 2002 Canadian data from Environment Canada; 1999 Mexican data from inventory prepared by Acosta y Asociados for the Commission for Environmental Cooperation
size/shape of symbol denotes amount of mercury emitted (kg/yr) 5 - 10 10 - 50 50 - 100 100 – 300 300 - 500 500 - 1000 1000 - 3500 color of symbol denotes type of mercury source coal-fired power plants other fuel combustion waste incineration metallurgical manufacturing & other Particulate Mercury -- Hg(p) -- Emissions to the Air 2002 U.S. data from USEPA National Emissions Inventory (NEI); 2002 Canadian data from Environment Canada; 1999 Mexican data from inventory prepared by Acosta y Asociados for the Commission for Environmental Cooperation
size/shape of symbol denotes amount of mercury emitted (kg/yr) 5 - 10 10 - 50 50 - 100 100 – 300 300 - 500 500 - 1000 1000 - 3500 color of symbol denotes type of mercury source coal-fired power plants other fuel combustion waste incineration metallurgical manufacturing & other Total Mercury Emissions to the Air [ Hg(0) + RGM + Hg(p) ] 2002 U.S. data from USEPA National Emissions Inventory (NEI); 2002 Canadian data from Environment Canada; 1999 Mexican data from inventory prepared by Acosta y Asociados for the Commission for Environmental Cooperation
Why is emissions speciation information critical? Logarithmic NOTE: distance results averaged over all directions – Some directions will have higher fluxes, some will have lower
Some events in the U.S. regulation and prevention of mercury emissions 1965 1970 1975 1970’s - 1990’s: many mercury-cell chlor-alkali plants converted to alternate processes or closed due to regulatory and other pressures 1980 1985 Clean Air Act Amendments of 1990 – calls for Maximum Achievable Control Technology (MACT) to regulate hazardous air pollutants; intent is to prohibit emissions trading for these air toxics 1990 • 1990’s – Hg emissions from municipal and medical waste incinerators fall dramatically due to: • closure of some municipal waste incinerators and many medical waste incinerators • MACT-related pollution control requirements • reduction in mercury content of waste (e.g., battery legislation) 1995 2002 – Clear Skies Initiative for power plants introduced (ultimately withdrawn) 2000 2005 – CAIR (Clean Air Interstate Rule) for power plants (Hg reduced as co-benefit of SO2 & NOx controls) 2005 – EPA meets court-ordered deadline and promulgates CAMR (Clean Air Mercury Rule) for power plants – based on Hg emissions trading 2005 “Hot Spot” Controversy -- Many States sue EPA & propose / promulgate more strict regulations 2010 2008 – CAMR and CAIR overturned... What is next?
Direct, Anthropogenic Mercury Emissions in the United States (data from USEPA)
Canaan Valley Institute-NOAA Beltsville EPA-NOAA Grand Bay NOAA Largest sources of total mercury emissions to the air in the U.S. and Canada, based on the U.S. EPA 1999 National Emissions Inventory and 1995-2000 data from Environment Canada Three NOAA sites committed to emerging inter-agency speciated mercury ambient concentration measurement network (comparable to Mercury Deposition Network (MDN) for wet deposition, but for air concentrations) 13
Monitoring Site NOAA SEARCH USGS UWF/FSU MDN type of mercury emissions source coal-fired power plant waste incinerator manufacturing total atmospheric mercury emissions (kg/yr, 1999 EPA NEI) metallurgical other fuel combustion 1 – 50 50 - 100 100 - 200 200 - 400 Mississippi Alabama Barry MS 22 paper manuf paper manuf AL02 Pascagoula MSW incin Mobile Molino Crist Victor J. Daniel Holcim Cement Pace OLF haz waste incin Ellyson AL24 Weeks Bay Mobile Bay Jack Watson Pascagoula NOAA Grand Bay NERR Hg site
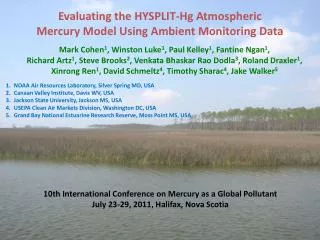
Atmospheric Mercury Measurement Site at the Grand Bay NERR, MS view from top of the tower mercury and trace gas monitoring tower (10 meters)
Atmospheric Measurements at the Grand Bay NERR “Speciated” Atmospheric Mercury Concentrations Trace gases to help understand and interpret mercury data Meteorological Data WET DEPOSITION: Currently being added, in collaboration with MS DEQ and U.S. EPA
Instrumentation inside the trailer at the Grand Bay NERR site
Can we learn what is needed about atmospheric mercury deposition by making atmospheric measurements alone? NO…
to get comprehensive source attribution information ...we don’t just want to know how much is depositing at any given location, we also want to know where it came from: • different source regions (local, regional, national, global) • different jurisdictions (different states and provinces) • anthropogenic vs. natural emissions • different source types (power plants, waste incin., smelters…) Why do we need atmospheric mercury models?
to get comprehensive source attribution information ...we don’t just want to know how much is depositing at any given location, we also want to know where it came from: • different source regions (local, regional, national, global) • different jurisdictions (different states and provinces) • anthropogenic vs. natural emissions • different source types (power plants, waste incin., smelters…) • to estimate deposition over large regions …because deposition fields are highly spatially variable, and one can’t measure everywhere all the time… Why do we need atmospheric mercury models?
to get comprehensive source attribution information ...we don’t just want to know how much is depositing at any given location, we also want to know where it came from: • different source regions (local, regional, national, global) • different jurisdictions (different states and provinces) • anthropogenic vs. natural emissions • different source types (power plants, waste incin., smelters…) • to estimate deposition over large regions …because deposition fields are highly spatially variable, and one can’t measure everywhere all the time… • to estimate dry deposition ... presently, dry deposition can only be estimated via models Why do we need atmospheric mercury models?
to get comprehensive source attribution information ...we don’t just want to know how much is depositing at any given location, we also want to know where it came from: • different source regions (local, regional, national, global) • different jurisdictions (different states and provinces) • anthropogenic vs. natural emissions • different source types (power plants, waste incin., smelters…) • to estimate deposition over large regions …because deposition fields are highly spatially variable, and one can’t measure everywhere all the time… • to estimate dry deposition ... presently, dry deposition can only be estimated via models • to evaluate potential consequences of future emissions scenarios Why do we need atmospheric mercury models?
Models are not perfect “…Everyone believes monitoring results except for the person making the measurements… and nobody believes modeling results except for the person doing the modeling…” How not perfect are they? Results are encouraging, but difficult to evaluate models due to lack of contemporaneous monitoring and emissions inventory data Models are a test of our knowledge… If they don’t work, fundamental things about our understanding of atmospheric mercury that are wrong or incomplete… More certain info at a few locations (monitoring) vs. less certain info region-wide (modeling)
Lagrangian Puff Atmospheric Fate and Transport Model 0 1 2 TIME (hours) The puff’s mass, size, and location are continuously tracked… = mass of pollutant (changes due to chemical transformations and deposition that occur at each time step) Phase partitioning and chemical transformations of pollutants within the puff are estimated at each time step Initial puff location is at source, with mass depending on emissions rate Centerline of puff motion determined by wind direction and velocity Dry and wet deposition of the pollutants in the puff are estimated at each time step. deposition 2 deposition to receptor deposition 1 lake NOAA HYSPLIT MODEL 25
(Evolving) Atmospheric Chemical Reaction Scheme for Mercury ? ? new ?
When puffs grow to sizes large relative to the meteorological data grid, they split, horizontally and/or vertically Ok for regional simulations, but for global modeling, puff splitting overwhelms computational resources
Due to puff splitting, the number of puffs quickly overwhelms numerical resources In this example, the maximum number of puffs was set to 100,000, so when it got close to that number, the splitting was turned off Exponential puff growth
In each test, the number of puffs rises to the maximum allowable within ~ one week This line is the example from the last slide
In the new version of HYSPLIT (4.9), puffs are “dumped” into an Eulerian grid after a specified time (e.g., 96 hrs), and the mercury is simulated on that grid from then on…
Inputs to Model land use meteorology emissions For model evaluation, model inputs must be for the same time period as measurement data Atmospheric Mercury Model atmospheric chemistry wet and dry deposition phase partitioning Model Evaluation Wet deposition data Speciated ambient concentration data Model Inter-comparison Model Visualization Model Outputs Wet and dry deposition of different Hg forms to sensitive ecosystems Source attribution information for deposition
Model Outputs Wet and dry deposition of different Hg forms to sensitive ecosystems Source attribution information for deposition Inputs to Model land use meteorology emissions For model evaluation, model inputs must be for the same time period as measurement data Atmospheric Mercury Model atmospheric chemistry wet and dry deposition phase partitioning Model Evaluation JSU collaboration Wet deposition data Speciated ambient concentration data Collaboration with JSU is providing a unique and unprecedented opportunity to evaluate and improve atmospheric mercury models Model Inter-comparison Model Visualization
We are organizing the initial collaborative work around specific episodes of high concentration of one or more mercury forms 36
Hg from other sources: local, regional & more distant atmospheric deposition to the water surface atmospheric deposition to the watershed Measurement of ambient air concentrations Measurement of wet deposition 39
Oct Nov Dec Jan Feb Mar Apr May Jun Jul Aug Sep Recent RGM concentrations measured at the Grand Bay NERR Then down for ~2 months due to hurricanes …. …. 2007 2008
Elemental Mercury [Hg(0)] Upper atmospheric halogen-mediated heterogeneous oxidation? Polar sunrise “mercury depletion events” Hg(II), ionic mercury, RGM Particulate Mercury [Hg(p)] Br cloud CLOUD DROPLET Hg(II) reducedto Hg(0) by SO2 and sunlight Vapor phase: Hg(0) oxidized to RGM and Hg(p) by O3, H202, Cl2, OH, HCl Adsorption/ desorption of Hg(II) to /from soot Hg(p) Primary Anthropogenic Emissions Hg(0) oxidized to dissolved Hg(II) species by O3, OH, HOCl, OCl- Wet deposition Multi-media interface Dry deposition Re-emission of previously deposited anthropogenic and natural mercury Natural emissions Atmospheric Mercury Fate Processes
Environmental Mercury Cycling -- Natural vs. Anthropogenic • Mercury (Hg) is an element... there is the same amount of mercury on Earth today as there always has been • “natural” Hg cycle – Hg is transported throughout the environment, and chemical transformations interconvert different mercury species • This has always been going on, and there has always been Hg in fish • But, we make some Hg unexpectedly “bioavailable” • Most anthropogenic Hg is “released” as atmospheric emissions: • Hg in coal is released to the air when coal is burned • Hg in other fuels is released to the air when they are processed and burned • Hg in ores is released to the air during metallurgical processes • Hg in products is released to the air when burned or landfilled after being discarded (e.g., batteries, switches) • Average, current atmospheric Hg deposition is ~3x pre-industrial levels • Evidence suggests that newly deposited Hg is more bioavailable
Freemont Glacier, Wyoming source: USGS, Shuster et al., 2002 Natural vs. anthropogenic mercury? Studies show that anthropogenic activities have typically increased bioavailable Hg concentrations in ecosystems by a factor of 2 – 10
atmospheric deposition to the watershed atmospheric deposition to the water surface Humans and wildlife affected primarily by eating fish containing mercury Best documented impacts are on the developing fetus: impaired motor and cognitive skills Mercury transformed by bacteria into methylmercury in sediments, soils & water, then bioaccumulates in fish adapted from slides prepared by USEPA and NOAA
What Do We Need to Know Regarding Atmospheric Mercury? * consistent with the needs of subsequent analyses (e.g., ecosystem modeling) with respect to spatial, temporal, and “species” resolution (e.g., Hg(0) vs. RGM vs. Hg(p))