Download
1 / 18
180 likes | 306 Views
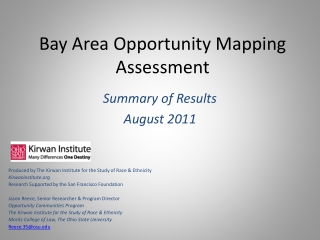
Mapping Opportunity in the Baltimore Region. Jason Sartori National Center for Smart Growth jsartori@umd.edu April 12, 2013. Neighborhood conditions and access to opportunity play a crucial role in life outcomes. ( Kirwan Institute, 2007) Opportunity:

E N D
Mapping Opportunity in the Baltimore Region Jason Sartori National Center for Smart Growth jsartori@umd.edu April 12, 2013
Neighborhood conditions and access to opportunity play a crucial role in life outcomes. (Kirwan Institute, 2007) • Opportunity: • A set of circumstances that makes it possible to do something. (Google) • Includes the structures of environmental conditions that contributed to community stability and individual advancement. (Kirwan Institute) • Access to Opportunity: Deliberately connecting people to the critical resources needed to excel and succeed in society. (Kirwan Institute)
Opportunity mapping is a process and a tool that allows us to identify areas of high or low opportunity. • Can also assess the accessibility of different population groups to various forms of opportunity.
Where you live generally determines: • The quality of schools your children attend • Access to employment • Access to health care and other services • Exposure to crime • Exposure to environmental and health risks • Understanding the opportunity landscape in the Baltimore metropolitan region is vital to strengthening the region’s quality of life and making the region more sustainable.
Kirwan: Austin, TX Source: The Kirwan Institute for the Study of Race and Ethnicity, “The Geography of Opportunity: Austin Region,” 2007. http://www.greendoors.org/docs/opportunity_mapping/Austin_Opportunity_Report.pdf
Kirwan: Connecticut Source: The Kirwan Institute for the Study of Race and Ethnicity, “Connecticut Opportunity Mapping Initiative: Results and Resource Materials,” 2009. http://kirwaninstitute.osu.edu/connecticut-opportunity-mapping-initiative-results-and-resource-materials/
Kirwan: Puget Sound Source: The Kirwan Institute for the Study of Race and Ethnicity, “Equity, Opportunity, And Sustainability In The Central Puget Sound Region,” 2012. http://www.psrc.org/assets/7831/EquOppSusReport2.pdf
Kirwan: Baltimore • Economic Opportunity and Mobility • Number of estimated entry level and low skill employment • Ratio of entry level and low skill employment opportunities per 1,000 residents • Absolute change in employment from 1998 to 2002 • Access to public transit • Median commute time • Neighborhood Health • Population change from 1990 to 2000 • Estimated crime rates in 2000 • Poverty Rates for the general population in 2000 • Vacant property rates in 2000 • Median home value in 2000 • Educational Opportunity • Proportion of FARM students of elementary and middle school • Proportion of classes not taught by highly qualified teachers in 2004 • Proportion of elementary students proficient in reading • Proportion of elementary students proficient in math Source: The Kirwan Institute for the Study of Race and Ethnicity, 2005.
Opportunity Collaborative Process • Comprehensive review of indicators with Opportunity Mapping Advisory Panel (OMAP) • OMAP meetings include consortium partners from across the region as well as subject matter experts • Weighting exercises
DATA DISTRIBUTION • RACIAL DIVERSITY INDEX* • Region – 0.32 • Anne Arundel – 0.34 • Baltimore – 0.33 • Carroll – 0.13 • Harford – 0.27 • Howard – 0.52 • Baltimore City – 0.28 • OPPORTUNITY RELATIONSHIP • Direct • DATA SOURCE • U.S. Census Bureau, American Community Survey 5-year Estimates, 2011 CORRELATION COEFFICIENTS * Averages of census tracts in each jurisdiction.
DATA DISTRIBUTION • MEDIAN HOUSEHOLD INCOME • Anne Arundel – $85,690 • Baltimore – $65,411 • Carroll – $83,325 • Harford – $79,953 • Howard – $105,692 • Baltimore City – $40,100 • OPPORTUNITY RELATIONSHIP • Direct • DATA SOURCE • U.S. Census Bureau, American Community Survey 5-year Estimates, 2011 CORRELATION COEFFICIENTS
DATA DISTRIBUTION • BACHELOR’S DEGREE • Anne Arundel – 36.3% • Baltimore – 35.2% • Carroll – 31.5% • Harford – 30.9% • Howard – 58.7% • Baltimore City – 25.8% • OPPORTUNITY RELATIONSHIP • Direct • DATA SOURCE • U.S. Census Bureau, American Community Survey 5-year Estimates, 2011 CORRELATION COEFFICIENTS
MEDIAN HOUSING VALUE • Anne Arundel - $361,700 • Baltimore - $269,400 • Carroll - $342,900 • Harford - $295,900 • Howard - $447,000 • Baltimore City - $163,700 • DATA SOURCE • U.S. Census Bureau, American Community Survey 5-year Estimates, 2011
LOCAL H+T AFFORDABILITY • Housing plus transportation cost as a percent of median income (for the Census tract) • Region – 46.5% • Anne Arundel – 40.5% • Baltimore – 46.8% • Carroll – 43.7% • Harford – 42.6% • Howard – 38.2% • Baltimore City – 64.5% • DATA SOURCES • H+T Costs: Center for Neighborhood Technology, 2009 • Median Income: U.S. Census Bureau, American Community Survey 5-year Estimates, 2009
REGION H+T AFFORDABILITY • Housing plus transportation cost as a percent of AMI (region includes Queen Anne’s County) • Region – 46.5% • Anne Arundel – 52.6% • Baltimore – 45.1% • Carroll – 53.1% • Harford – 49.9% • Howard – 57.9% • Baltimore City – 35.6% • DATA SOURCE • Center for Neighborhood Technology, 2009
INDICATOR TITLE Elementary School Performance DESCRIPTION Average combined ‘proficient’ and ‘advanced’ score share of all elementary school Maryland School Assessment scores. RELATIONSHIP TO OPPORTUNITY Direct SOURCE MSDE, 2011