Download
1 / 26
260 likes | 370 Views
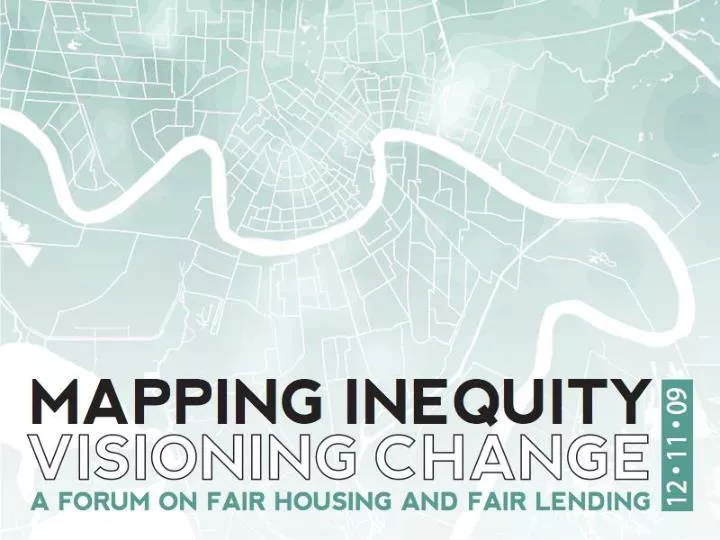
Mapping Communities of Opportunity in New Orleans. December 11, 2009. Samir Gambhir Senior Research Associate Kirwan Institute for the study of Race and Ethnicity The Ohio State University Gambhir.2@osu.edu. Inequality has a geographic footprint

E N D
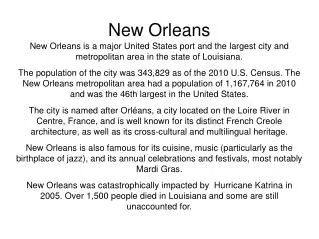
Mapping Communities of Opportunity in New Orleans December 11, 2009 Samir Gambhir Senior Research Associate Kirwan Institute for the study of Race and Ethnicity The Ohio State University Gambhir.2@osu.edu
Inequality has a geographic footprint Maps can visually track the history and presence of discriminatory and exclusionary policies that spatially segregate people Identifying places with gaps in opportunity can help direct future investment and identify structures which impede access to opportunity Mapping Opportunity: Why and How
“Opportunity” is a situation or condition that places individuals in a position to be more likely to succeed or excel. Opportunity structures are critical to opening pathways to success: High-quality education Healthy and safe environment Stable housing Sustainable employment Political empowerment Outlets for wealth-building Positive social networks Opportunity Matters: Space, Place, and Life Outcomes
Some people ride the “Up” escalator to reach opportunity. Others have to run up the “Down” escalator to get there.
Opportunity Mapping framework • A research tool used to understand the dynamics of “opportunity” within a region • To illustrate where opportunity rich communities exist (and assess who has access to these communities) • Also, to understand what needs to be remedied in opportunity poor communities
A refined model to depict spatial pattern of opportunity Identifying indicators as proxy for opportunity Supported by social science literature Data easily available Index based approach compresses multi-factors to an index Model is a good communications tool to work with communities Opportunity Mapping Model
Indicators as proxy for opportunity were identified in consultation with GNOFHAC and GNOCDC Indicators selected represented five areas of opportunity: Education quality and opportunity Economic Opportunity and mobility Housing and Neighborhood Public Health access Environmental quality Mapping Communities of Opportunity (Post-Katrina): Indicators
Indicators dropped • Student poverty rate • Test scores for neighborhood schools • Teacher qualifications • Incarceration Rate • Public Transit Access • Unemployment Rates • Population on Public Assistance • Vehicle Ownership • Home Ownership Rate • Blighted Properties • Poverty Rate
Data representing community conditions was gathered for the city of New Orleans aggregated to the neighborhood (Census Tract) level and analyzed to create a comprehensive opportunity index The opportunity index is then mapped and census tracts are broken into quintiles based on their opportunity score Very Low, Low, Moderate, High, Very High Mapping Communities of Opportunity (Post-Katrina): Methods
Reflections • Opportunity mapping • Metropolitan wide analysis • Using public (e.g. census, state and local) and private (e.g. ESRI) data • Mapped opportunity distribution
Observations • Section 8 housing primarily concentrated in low and very low opportunity areas • Voucher recipients might have fewer choices outside low opportunity areas • A system of disadvantage that affects life outcomes • Re-concentrating poverty • Audit by GNOFHAC • Prevalent discrimination • Reduced housing choice
Next Steps • Update opportunity distribution • Based on Census 2010 data • Identify additional indicators • Overlay • Provide additional overlays • Get detailed information on voucher movers • Neighborhood analysis for voucher movers
Thank you!For questions, comments or for more information: www.kirwaninstitute.orgor e-mail us at Gambhir.2@osu.edu