Download
1 / 22
220 likes | 338 Views
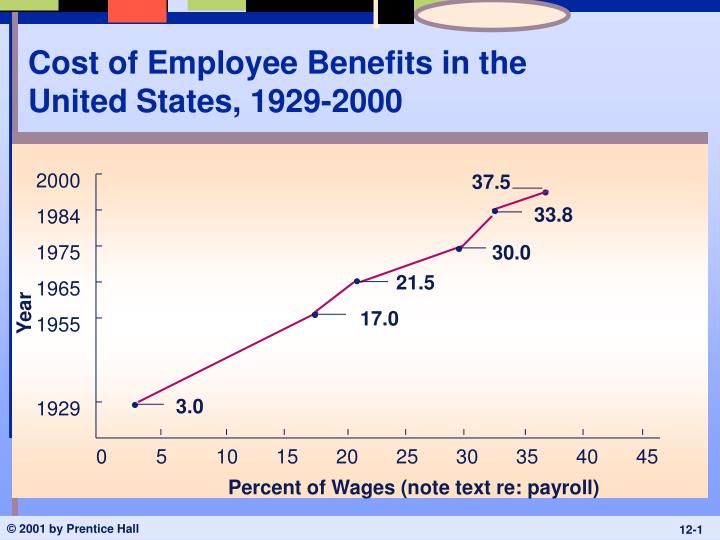
Cost of Employee Benefits in the United States, 1929-2000. 2000. 37.5. 33.8. 1984. 1975. 30.0. 21.5. 1965. Year. 17.0. 1955. 3.0. 1929. 0. 5. 10. 15. 20. 25. 30. 35. 40. 45. Percent of Wages (note text re: payroll). How the Benefits Dollar Is Spent.

E N D
Cost of Employee Benefits in the United States, 1929-2000 2000 37.5 33.8 1984 1975 30.0 21.5 1965 Year 17.0 1955 3.0 1929 0 5 10 15 20 25 30 35 40 45 Percent of Wages (note text re: payroll)
Fig 12.2: Percentage of Employers Providing Selected Benefit Plans Medium and Large Private Firms Small Private Firms State and Local Governments Health Insurance Retirement Plans Defined Benefit Plans Defined Contribution Plans Insurance Plans Life Insurance Long-term Disability Ins Time-off Plans Paid Vacations Paid Holidays Paid Sick Leave Flexible Benefits Plans 74 21 56 77 45 98 100 50 12 88 83 29 75 35 100 100 59 34 60 9 42 54 25 87 100 26 4 U.S. Sept. of Labor, Bureau of Labor Statistics (2000). Employee Benefits in state and local governments, 1998.
Legally Required Benefits • Social Security • Retirement Income • Disability Income • Medicare • Survivor Benefits • Workers’ Compensation • Unemployment Insurance • Unpaid Leave
Family and Medical Leave • Although FMLA was widely perceived as maternity leave law, more than 80% of time it’s used by workers recovering from own illness or caring for sick family member • Half of FMLA use involves serious illnesses lasting less than 10 days • 42% of users are male Source: Business Week, 6/13/05
Social Security in Context • Before Social Security, aging in America often meant poverty and sometimes poorhouse • Average life expectancy in 1900: 47 years • When America was agricultural nation, elderly frequently lived w/ children • By 1920, more Americans lived in cities than on farms, urban homes smaller • While life expectancy was increasing quickly, many Ers shunned older workers • In 1930, almost 1/3 of American factories had maximum age limits for new ees (40, 45, 50) • Retirement savings didn’t exist, except among wealthiest Americans • In early 20th century, only ~2% of ees covered by pensions • Most counties had poorhouse (shelters for indigent) • Germany, Sweden, France, England legislated publicly-funded old-age insurance before Americans took up debate • Opponents argued that sensible people would provide for themselves • Social Security Act ruled to be constitutional by 5-4 decision in 1937 • Source: Wall Street Journal, 9/15/04
Benefit Trends: Health Care • Ees rank health-care related benefits as most important • 65% view as most important • 17% as second-most important • Less than 3% of U.S. health care spending can be attributed to preventive medicine and health education • Estimated that as much as 50% of costs of illness in U.S. results from conditions that could be avoided or lessened by preventive care or healthy lifestyle changes • Nearly 23% of population has body mass index of 30 or higher (30 lbs over healthy weight) • Source: Compensation and Benefits Review, Sept/Oct 2000; USA Today, 11/7/04
Health Care Costs • Considerable cost-shifting to Ees • Costs increased 10.1% in 2003 (have moderated since, somewhat) • Biggest cost drivers: more prescriptions of heavily-marketed drugs, increases in hospital prices, more expensive diagnostic tests, increase in visits to specialists (given shift from more restrictive HMOs) • Average cost per Ee, 2004: $6,679 • Up 86% since 1997 ($3,594) • 15.7% of U.S. population (~46m) now uninsured • 60% of Americans covered by Er-sponsored health benefits • Between 1996 and 2004, number of private-sector ees who enrolled in health benefits plans offered to them declined from 88% to 81% • Source: Mercer Human Resource Consulting, Census Bureau, Wall Street Journal, 11/2204; USA Today, 8/30/05; Wall Street Journal, 8.25/06
Workers Paying More of Health-Care Bills • Ees provided family coverage thru Ers contributed $2,412 on average in 2003, up from $1,619 in 2000 • Causing divides between lower- and higher-income workers in terms of health-care affordability • Average premium for family plan increased from $6,438 in 2000 to $9,068 in 2003 • Ees provided individual coverage thru Ers contributed $454 on average in 2002, up 27% • Ers paid $2,066 for individual, up 14% • On average, Ees pay about 16% of cost of single coverage, about 27% of cost of family coverage • Ees obtaining brand-name drug when generic is available paid $26 on average, up 24% • Average deductible in PPO plans increased 37%, to $276 • Source: Wall Street Journal, 9/6/02
Legal Environment for Health Care Plans • Consolidated Omnibus Budget Reconciliation Act (COBRA) • Must offer extended group health plan participation for up to 18 months following termination, 36 months for divorced/deceased spouse • Cost borne by individual • Health Insurance Portability and Accountability Act (HIPAA) • Improves ‘portability’ of health insurance (limits exclusions for pre-existing conditions, discrimination based on health status) • Does not… • Ensure that Ee who changes jobs will have access to health insurance on new job • Ensure affordability of health insurance on new job • Enable individuals to maintain same group health plan on job change • Privacy of health information
Health Care Costs and Firm Competitiveness • In 2004 health-care spending amounted to over $1,500 for every vehicle GM produced in U.S. (Chrysler, $1,400; Ford, $1,100) • American workers on average pay ~32% of their health costs, GM salaried ees ~27%, UAW members ~7% • Current ees and families account for 1/3 of total health bill, retirees the remainder • Competition prevents passing on cost to customers • Japanese competitors have younger workforces with lower costs • As of 2003, Big Three had 524,000 hourly retirees, Toyota 49 (258 as of 2006) • Expense impacts bottom-line and investment in R&D • See also “As Benefits for Veterans Climb, Military Spending Feels Squeeze,” Wall Street Journal, 1/25/05 • Adding prescription drug benefit to Medicare will save automakers millions • Companies lobbied for legislation that would cover all over 65, even those with retiree health coverage thru Er • GM spends $924 million annually on prescription drugs for retirees, including those under age 65, Ford spends $300 million • Source: Fortune, 9/29/03; Wall Street Journal, 4/7/05, 4/15/05; New York Times, 5/19/06
Health Benefits for Retirees Continue to Shrink • 17% of retiree health plans have virtually eliminated liabilities by requiring retirees to pay full premiums • 20% have eliminated such plans altogether for new hires • Share of private-sector orgs offering health insurance to retirees 65+ dropped to 11% in 2000, from 20% in 1997 • Source: Wall Street Journal, 9/16/02
“Consumer-Driven” Health Plans, Health Savings Accounts (HSAs), Health Reimbursement Accounts (HRAs) • Congress authorized HSAs in 2003, HRAs evolved in late 90s and early 00s • Lower premiums, higher deductible (e.g., $2,000/yr), more consumer control of health care expenditures • Er can match part or all of Ee contribution to account • Pre-tax dollars into HSA, up to amount of deductible • If you don’t spend all your allowance on medical care, you carry over unused balance • Once deductible is paid, traditional insurance policy takes over • Maximum out-of-pocket spending limits ($5k for individuals, $10k for families)
“Consumer-Driven” Health Plans, Health Savings Accounts (HSAs), and Health Reimbursement Accounts (HRAs) • Encourages consumers to take active role in keeping health-care costs down • Ers will provide detailed information about prices and quality of doctors and hospitals in area • Critics fear plans will discourage people from getting care they need • Recent research indicates that when co-payments for prescription drugs increase, health of patients w/ certain chronic illnesses (e.g., diabetes and asthma) can suffer • Further, if healthy Ees sign up for HSAs while less-healthy Ees stick w/ traditional plans, costs of those plans will increase at even faster rate… • Tax breaks benefit wealthy more than low-income workers • Less-educated workers may have trouble taking advantage of Web-based information • By 2006 73% of U.S. Ers likely or somewhat likely to offer HSAs • Source: USA Today, 10/31/03; Wall Street Journal, 6/23/04; Wall Street Journal, 5/19/04; Business Week, 11/8/04
Advantages and Disadvantages of Flexible Benefit Programs • Advantages • Employees choose packages that best satisfy their unique needs • Flexible benefits help firms meet the changing needs of a changing work force • Increased involvement of employees and families improves understanding of benefits • Makes introduction of new benefits less costly – added as one option among many • Cost containment – organization sets dollar maximum, Ee chooses within that constraint
Advantages and Disadvantages of Flexible Benefit Programs • Disadvantages • Ees make bad choices and find themselves not covered for predictable emergencies • Administrative burdens and expenses increase • Adverse selection – Ees pick only benefits they will use, thus driving up costs