Download

1 / 89
890 likes | 899 Views
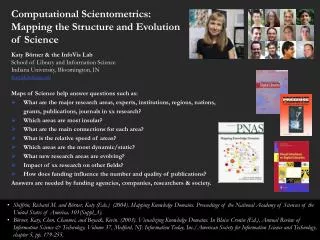
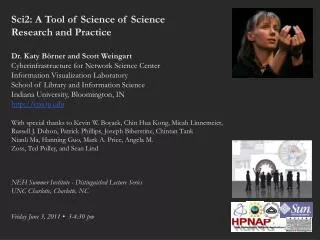
Sci2: A Tool of Science of Science Research and Practice Dr. Katy Börner and Scott Weingart Cyberinfrastructure for Network Science Center Information Visualization Laboratory School of Library and Information Science Indiana University, Bloomington, IN http://cns.iu.edu

E N D
Sci2: A Tool of Science of Science Research and Practice Dr. Katy Börner and Scott Weingart Cyberinfrastructure for Network Science Center Information Visualization Laboratory School of Library and Information Science Indiana University, Bloomington, IN http://cns.iu.edu With special thanks to Kevin W. Boyack, Chin Hua Kong, Micah Linnemeier, Russell J. Duhon, Patrick Phillips, Joseph Biberstine, Chintan Tank Nianli Ma, Hanning Guo, Mark A. Price, Angela M. Zoss, Ted Polley, and Sean Lind NEH Summer Institute - Distinguished Lecture Series UNC Charlotte, Charlotte, NC Friday June 3, 2011 • 3-4:30 pm
Online Resources • These slides http://sci2.cns.iu.edu/docs/2011-borner-ISSI-Tutorial.pdf • Sci2 Tool Manual v0.5.1 Alpha http://sci2.wiki.cns.iu.edu • Sci2 Tool v0.5.1 Alpha (May 4, 2011) http://sci2.cns.iu.edu • Additional Datasets http://sci2.wiki.cns.iu.edu/2.5+Sample+Datasets • Additional Plugins http://sci2.wiki.cns.iu.edu/3.2+Additional+Plugins Or copy them from the memory stick. 2
1:30 Macroscope Design and Usage & CIShell Powered Tools: NWB & Sci2 1:45 Sci2 Tool Basics Download and run the tool. 2:00 Sci2 Sample Workflow: Padgett's Florentine Families - Prepare, load, analyze, and visualize family and business networks from 15th century Florence. 2:30 Sci2 Sample Workflow: Studying Four Major NetSci Researchers. Load and clean a dataset as text file; process raw data into networks. Find basic statistics and run various algorithms over the network. Visualize as either a circular hierarchy or network 3:30 Break 4:00 Sci2 Demo I: Geospatial maps with congressional districts 4:30 Sci2 Demo II: Evolving collaboration networks 4:45 Outlook and Discussion 5:00 Adjourn Workshop Overview 3
1:30 Macroscope Design and Usage & CIShell Powered Tools: NWB & Sci2 1:45 Sci2 Tool Basics Download and run the tool. 2:00 Sci2 Sample Workflow: Padgett's Florentine Families - Prepare, load, analyze, and visualize family and business networks from 15th century Florence. 2:30 Sci2 Sample Workflow:Studying Four Major NetSci Researchers. Load and clean a dataset as text file; process raw data into networks. Find basic statistics and run various algorithms over the network. Visualize as either a circular hierarchy or network 3:30 Break 4:00 Sci2 Demo I: Geospatial maps with congressional districts 4:30 Sci2 Demo II: Evolving collaboration networks 4:45 Outlook and Discussion 5:00 Adjourn Workshop Overview 4 4
Macroscopes Serve the Changing Scientific Landscape Different datasets/formats. Diverse algorithms/tools written in many programming languages. Physics IS SNA CS Bio 5
Star Scientist -> Research Teams: In former times, science was driven by key scientists. Today, science is driven by effectively collaborating co-author teams often comprising expertise from multiple disciplines and several geospatial locations (Börner, Dall'Asta, Ke, & Vespignani, 2005; Shneiderman, 2008). Users -> Contributors: Web 2.0 technologies empower anybody to contribute to Wikipedia or to exchange images and videos via Fickr and YouTube. WikiSpecies, WikiProfessionals, or WikiProteins combine wiki and semantic technology in support of real time community annotation of scientific datasets (Mons et al., 2008). Cross-disciplinary: The best tools frequently borrow and synergistically combine methods and techniques from different disciplines of science and empower interdisciplinary and/or international teams of researchers, practitioners, or educators to fine-tune and interpret results collectively. One Specimen -> Data Streams: Microscopes and telescopes were originally used to study one specimen at a time. Today, many researchers must make sense of massive streams of multiple types of data with different formats, dynamics, and origin. Static Instrument -> Evolving Cyberinfrastructure (CI): The importance ofhardware instruments that are rather static and expensive decreases relative to software infrastructures that are highly flexible and continuously evolving according to the needs of different sciences. Some of the most successful services and tools are decentralized increasing scalability and fault tolerance. The Changing Scientific Landscape 6
Custom Tools for Different Scientific Communities Information Visualization Cyberinfrastructure http://iv.cns.iu.edu Network Workbench Tool + Community Wiki http://nwb.cns.iu.edu Science of Science (Sci2) Tool and Portal http://sci2.cns.iu.edu Epidemics Cyberinfrastructure Coming soon 180+ Algorithm Plugins and Branded GUIs + Core Architecture Open Services Gateway Initiative (OSGi) Framework. http://orgi.org Cyberinfrastructure Shell (CIShell) http://cishell.org Macroscope Design 7
CIShell Powered Tools: Network Workbench (NWB) 8
Network Workbench Toolhttp://nwb.slis.indiana.edu The Network Workbench (NWB) tool supports researchers, educators, and practitioners interested in the study of biomedical, social and behavioral science, physics, and other networks. In February 2009, the tool provides more 169 plugins that support the preprocessing, analysis, modeling, and visualization of networks. More than 50 of these plugins can be applied or were specifically designed for S&T studies. It has been downloaded more than 65,000 times since December 2006. Herr II, Bruce W., Huang, Weixia (Bonnie), Penumarthy, Shashikant & Börner, Katy. (2007). Designing Highly Flexible and Usable Cyberinfrastructures for Convergence. In Bainbridge, William S. & Roco, Mihail C. (Eds.), Progress in Convergence - Technologies for Human Wellbeing (Vol. 1093, pp. 161-179), Annals of the New York Academy of Sciences, Boston, MA.
Project Details Investigators: Katy Börner, Albert-Laszlo Barabasi, Santiago Schnell, Alessandro Vespignani & Stanley Wasserman, Eric Wernert Software Team: Lead: Micah Linnemeier Members: Patrick Phillips, Russell Duhon, Tim Kelley & Ann McCranie Previous Developers: Weixia (Bonnie) Huang, Bruce Herr, Heng Zhang, Duygu Balcan, Bryan Hook, Ben Markines, Santo Fortunato, Felix Terkhorn, Ramya Sabbineni, Vivek S. Thakre & Cesar Hidalgo Goal: Develop a large-scale network analysis, modeling and visualization toolkit for physics, biomedical, and social science research. Amount: $1,120,926, NSF IIS-0513650 award Duration: Sept. 2005 - Aug. 2009 Website: http://nwb.slis.indiana.edu 10
Project Details (cont.) NWB Advisory Board: James Hendler (Semantic Web) http://www.cs.umd.edu/~hendler/ Jason Leigh (CI) http://www.evl.uic.edu/spiff/ Neo Martinez (Biology) http://online.sfsu.edu/~webhead/ Michael Macy, Cornell University (Sociology) http://www.soc.cornell.edu/faculty/macy.shtml Ulrik Brandes (Graph Theory) http://www.inf.uni-konstanz.de/~brandes/ Mark Gerstein, Yale University (Bioinformatics) http://bioinfo.mbb.yale.edu/ Stephen North (AT&T) http://public.research.att.com/viewPage.cfm?PageID=81 Tom Snijders, University of Groningen http://stat.gamma.rug.nl/snijders/ Noshir Contractor, Northwestern University http://www.spcomm.uiuc.edu/nosh/ 11
Computational Proteomics What relationships exist between protein targets of all drugs and all disease-gene products in the human protein–protein interaction network? Yildriim, Muhammed A., Kwan-II Goh, Michael E. Cusick, Albert-László Barabási, and Marc Vidal. (2007). Drug-target Network. Nature Biotechnology 25 no. 10: 1119-1126. 12
Computational Economics Does the type of product that a country exports matter for subsequent economic performance? C. A. Hidalgo, B. Klinger, A.-L. Barabási, R. Hausmann (2007) The Product Space Conditions the Development of Nations. Science 317, 482 (2007). 13
Computational Social Science Studying large scale social networks such as Wikipedia Second Sight: An Emergent Mosaic of Wikipedian Activity, The NewScientist, May 19, 2007
Computational Epidemics Forecasting (and preventing the effects of) the next pandemic. Epidemic Modeling in Complex realities, V. Colizza, A. Barrat, M. Barthelemy, A.Vespignani, Comptes Rendus Biologie, 330, 364-374 (2007). Reaction-diffusion processes and metapopulation models in heterogeneous networks, V.Colizza, R. Pastor-Satorras, A.Vespignani, Nature Physics 3, 276-282 (2007). Modeling the Worldwide Spread of Pandemic Influenza: Baseline Case and Containment Interventions, V. Colizza, A. Barrat, M. Barthelemy, A.-J. Valleron, A.Vespignani, PloS-Medicine 4, e13, 95-110 (2007).
NWB Tool Download, Install, and Run NWB Tool 1.0.0 Can be freely downloaded for all major operating systems from http://nwb.cns.iu.edu Select your operating system from the pull down menu and download. Unpack into a /nwb directory. Run /nwb/nwb.exe Session log files are stored in ‘*yournwbdirectory*/logs’ directory. Cite as NWB Team. (2006). Network Workbench Tool. Indiana University, Northeastern University, and University of Michigan, http://nwb.cns.iu.edu. 16
NWB Tool Interface Components Console shows references to seminal works. Workflows are recorded into a log file, and soon can be re-run for easy replication. All algorithms are documented online; workflows are given in tutorials.
File, Preprocessing, Modeling, and Visualization Menus Börner, Katy, Sanyal, Soma and Vespignani, Alessandro (2007). Network Science. In Blaise Cronin (Ed.), ARIST, Information Today, Inc./American Society for Information Science and Technology, Medford, NJ, Volume 41, Chapter 12, pp. 537-607. http://ivl.slis.indiana.edu/km/pub/2007-borner-arist.pdf 18
Analysis Menu and Submenus Börner, Katy, Sanyal, Soma and Vespignani, Alessandro (2007). Network Science. In Blaise Cronin (Ed.), ARIST, Information Today, Inc./American Society for Information Science and Technology, Medford, NJ, Volume 41, Chapter 12, pp. 537-607. http://ivl.slis.indiana.edu/km/pub/2007-borner-arist.pdf 19
CIShell – Customize Menu • The file ‘yourtooldirectory/configuration/default_menu.xml’ encodes the structure of the menu system. • In NWB Tool, the Modeling menu (left) is encoded by the following piece of xml code: 20
Integrated Tools Gnuplot portable command-line driven interactive data and function plotting utility http://www.gnuplot.info/. GUESS exploratory data analysis and visualization tool for graphs and networks. https://nwb.slis.indiana.edu/community/?n=VisualizeData.GUESS. 21
Supported Data Formats The NWB tool supports loading the following input file formats: • GraphML (*.xml or *.graphml) • XGMML (*.xml) • Pajek .NET (*.net) & Pajek .Matrix (*.mat) • NWB (*.nwb) • TreeML (*.xml) • Edge list (*.edge) • CSV (*.csv) • ISI (*.isi) • Scopus (*.scopus) • NSF (*.nsf) • Bibtex (*.bib) • Endnote (*.enw) and the following network file output formats: • GraphML (*.xml or *.graphml) • Pajek .MAT (*.mat) • Pajek .NET (*.net) • NWB (*.nwb) • XGMML (*.xml) • CSV (*.csv) Formats are documented at https://nwb.slis.indiana.edu/community/?n=DataFormats.HomePage. 22
CIShell Powered Tools: Science of Science (Sci2) Tool 23
Science of Science (Sci2) Toolhttp://sci2.cns.iu.edu • Explicitly designed for SoS research and practice, well documented, easy to use. • Empowers many to run common studies while making it easy for exports to perform novel research. • Advanced algorithms, effective visualizations, and many (standard) workflows. • Supports micro-level documentation and replication of studies. • Is open source—anybody can review and extend the code, or use it for commercial purposes. 24
OSGi/CIShell powered tool with NWB plugins and many new scientometrics and visualizations plugins. Börner, Katy, Huang, Weixia (Bonnie), Linnemeier, Micah, Duhon, Russell Jackson, Phillips, Patrick, Ma, Nianli, Zoss, Angela, Guo, Hanning & Price, Mark. (2009). Rete-Netzwerk-Red: Analyzing and Visualizing Scholarly Networks Using the Scholarly Database and the Network Workbench Tool. Proceedings of ISSI 2009: 12th International Conference on Scientometrics and Informetrics, Rio de Janeiro, Brazil, July 14-17 . Vol. 2, pp. 619-630. Sci2 Tool – “Open Code for S&T Assessment” GUESS Network Vis Sci Maps Horizontal Time Graphs 25
Sci2 Tool Geo Maps Circular Hierarchy
1:30 Macroscope Design and Usage & CIShell Powered Tools: NWB & Sci2 1:45 Sci2 Tool Basics Download and run the tool. 2:00 Sci2 Sample Workflow: Padgett's Florentine Families - Prepare, load, analyze, and visualize family and business networks from 15th century Florence. 2:30 Sci2 Sample Workflow:Studying Four Major NetSci Researchers. Load and clean a dataset as text file; process raw data into networks. Find basic statistics and run various algorithms over the network. Visualize as either a circular hierarchy or network 3:30 Break 4:00 Sci2 Demo I: Geospatial maps with congressional districts 4:30 Sci2 Demo II: Evolving collaboration networks 4:45 Outlook and Discussion 5:00 Adjourn Workshop Overview 27
Sci2 Tool: Download, Install, and Run Sci2 Tool v0.5 Alpha (April 4, 2011) Can be freely downloaded for all major operating systems from http://sci2.cns.iu.edu Select your operating system from the pull down menu and download. Unpack into a /sci2 directory. Run /sci2/sci2.exe Sci2 Manual is at http://sci2.wiki.cns.iu.edu Cite as Sci2 Team. (2009). Science of Science (Sci2) Tool. Indiana University and SciTech Strategies, http://sci2.cns.iu.edu .
Sci2 Tool: Download, Install, and Run • Sci2 Tool v0.5 Alpha (April 4, 2011) • Supports ASCII UTF-8 characters • Web-based Yahoo! and desktop Geocoders • U.S. and World geomapper • Customizable stop word lists • Merging of networks • New home page, wiki-based tutorial • Bug fixes, streamlined workflows • Sci2 Tool runs on Windows, Mac, and Linux. • Unzip. • Run /sci2/sci2.exe
Sci2 Tool Interface ComponentsSee also http://sci2.wiki.cns.iu.edu/2.2+User+Interface Use Menu to read data, run algorithms. Console to see work log, references to seminal works. Data Manager to select, view, save loaded, simulated, or derived datasets. Scheduler to see status of algorithm execution. All workflows are recorded into a log file (see /sci2/logs/…), and soon can be re-run for easy replication. If errors occur, they are saved in a error log to ease bug reporting. All algorithms are documented online; workflows are given in tutorials, see Sci2 Manual at http://sci2.wiki.cns.iu.edu
1:30 Macroscope Design and Usage & CIShell Powered Tools: NWB & Sci2 1:45 Sci2 Tool Basics Download and run the tool. 2:00 Sci2 Sample Workflow: Padgett's Florentine Families - Prepare, load, analyze, and visualize family and business networks from 15th century Florence. 2:30 Sci2 Sample Workflow: Studying Four Major NetSci Researchers. Load and clean a dataset as text file; process raw data into networks. Find basic statistics and run various algorithms over the network. Visualize as either a circular hierarchy or network 3:30 Break 4:00 Sci2 Demo I: Geospatial maps with congressional districts 4:30 Sci2 Demo II: Evolving collaboration networks 4:45 Outlook and Discussion 5:00 Adjourn Workshop Overview 31
Padgett's Florentine Families - Compute Basic Network Properties & View in GUESS • Florentine families related through business ties (specifically, recorded financial ties such as loans, credits and joint partnerships) and marriage alliances. • Node attributes • Wealth: Each family's net wealth in 1427 (in thousands of lira) • Priorates: The number of priorates (seats on the civic council) held between 1282- 1344 • Totalties: The total number of business or marriage ties in the total dataset of 116 families. • “Substantively, the data include families who were locked in a struggle for political control of the city of Florence around 1430. Two factions were dominant in this struggle: one revolved around the infamous Medicis, the other around the powerful Strozzis.” • http://svitsrv25.epfl.ch/R-doc/library/ergm/html/florentine.html 32
Padgett's Florentine Families - Compute Basic Network Properties & View in GUESS • Load *yoursci2directory*/sampledata/socialscience/florentine.nwb • Run ‘Analysis > Network Analysis Toolkit (NAT)’ to get basic properties. This graph claims to be undirected. Nodes: 16 Isolated nodes: 1 Node attributes present: label, wealth, totalities, priorates Edges: 27 No self loops were discovered. No parallel edges were discovered. Edge attributes: Nonnumeric attributes: Example value marriag...T busines...F Average degree: 3.375 There are 2 weakly connected components. (1 isolates) The largest connected component consists of 15 nodes. Did not calculate strong connectedness because this graph was not directed. Density (disregarding weights): 0.225 • Select network and run ‘Visualization > GUESS’ to open GUESS with file loaded. • Apply ‘Layout > GEM’. 33
Pan: “grab” the background by holding left-click and moving your mouse. Zoom: Using scroll wheel, press the “+” and “-” buttons in the upper-left hand corner, or right-click and move the mouse left or right. Center graph by selecting ‘View -> Center’. Select to select/move single nodes. Hold down ‘Shift’ to select multiple. Right click to modify Color, etc. 35
Graph Modifier: Select “all nodes” in the Object drop-down menu and click ‘Show Label’ button. Select ‘Resize Linear > Nodes > totalities’ drop-down menu, then type “5” and “20” into the From” and To” Value box separately. Then select ‘Do Resize Linear’. Select ‘Colorize> Nodes>totalities’, then select white and enter (204,0,51) in the pop-up color boxes on in the “From” and “To” buttons. Select “Format Node Labels”, replace default text {originallabel} with your own label in the pop-up box ‘Enter a formatting string for node labels.’ 36
Interpreter: Uses Jython a combination of Java and Python. Try colorize(wealth, white, red) 37
1:30 Macroscope Design and Usage & CIShell Powered Tools: NWB & Sci2 1:45 Sci2 Tool Basics Download and run the tool. 2:00 Sci2 Sample Workflow: Padgett's Florentine Families - Prepare, load, analyze, and visualize family and business networks from 15th century Florence. 2:30 Sci2 Sample Workflow: Studying Four Major NetSci Researchers. Load and clean a dataset; process raw data into networks. Find basic statistics and run various algorithms over the network. Visualize as either a circular hierarchy or network. 3:30 Break 4:00 Sci2 Demo I: Geospatial maps with congressional districts 4:30 Sci2 Demo II: Evolving collaboration networks 4:45 Outlook and Discussion 5:00 Adjourn Workshop Overview 38
Studying Four Major NetSci Researchers (ISI Data) using Database (section 5.1.4) Thomson Reuter’s Web of Knowledge (WoS) is a leading citation database. Access it via the “Web of Science” tab at http://www.isiknowledge.com (note: access to this database requires a paid subscription). Along with Scopus, WoS provides some of the most comprehensive datasets for scientometric analysis. To find all publications by an author, search for the last name and the first initial followed by an asterisk in the author field. http://sci2.wiki.cns.iu.edu/5.1.4+Studying+Four+Major+NetSci+Researchers+(ISI+Data) 39
Data Acquisition from Web of Science In Dec 2007, we downloaded all papers by • Eugene Garfield • Stanley Wasserman • Alessandro Vespignani • Albert-László Barabási from • Science Citation Index Expanded (SCI-EXPANDED) --1955-present • Social Sciences Citation Index (SSCI)--1956-present • Arts & Humanities Citation Index (A&HCI)--1975-present 40
Comparison of CountsNo books and other non-WoS publications are covered. Age Total # Cites Total # Papers H-Index Eugene Garfield 82 1,525 672 31 Stanley Wasserman 122 35 17 Alessandro Vespignani 42 451 101 33 Albert-László Barabási 40 2,218 126 47 (Dec 2007) 41 16,920 159 52 (Dec 2008) 44 30,102 201 68 (April 11) 41
Extract Co-Author Network Load*yoursci2directory*/sampledata/scientometrics/isi/FourNetSciResearchers.isi’ using 'File > Load …‘ And file with 361 records appears in the Data Manager. Duplicates were removed, author names normalized. Log file exists. 42
Extract Co-Author Network(see section 5.1.4.2 on correcting duplicate/misspelled author names) To extract the co-author network, select the ‘361 Unique ISI Records’ table and run ‘Data Preparation > Extract Co-Author Network’ using isi file format: The result is an undirected but weighted network of co-authors in the Data Manager. Run ‘Analysis > Network > Network Analysis Toolkit (NAT)’ to calculate basic properties: the network has 247 nodes and 891 edges. Use ‘Analysis > Network > Unweighted and Undirected > Node Degree’ to calculate the number of neighbors for each node independent of co-authorship weight. To view the complete network, select the ‘Extracted Co-Authorship Network’ and run ‘Visualization > Networks > GUESS’. Network is loaded with random layout. In GUESS, run ‘Layout > GEM’ and ‘Layout > Bin Pack’ to improve layout. Run 'Script > Run Script …' and select ' yoursci2directory/scripts/GUESS/co-author-nw.py'. 43
Co-Author Network of all Four NetsSci Researchers Use the GUESS Graph Modifier to change color and size coding. Calculate node degrees in Sci2 Tool. Use a graphic program to add legend. 45
Individual Co-Author Networks (Read/map 4 files separately) Eugene Garfield Stanley Wasserman Alessandro Vespignani Albert-László Barabási 46
Network Visualization: Node Layout Load and Clean ISI File was selected. Loaded 361 records. Removed 0 duplicate records. Author names have been normalized. 361 records with unique ISI IDs are available via Data Manager. .......... Extract Co-Author Network was selected. Input Parameters: File Format: isi .......... Network Analysis Toolkit (NAT) was selected. Nodes: 247 Edges: 891 .......... GUESS was selected. 47
Network Visualization: Color/Size Coding by Data Attribute Values 48
Network Visualization: Giant Component .......... Weak Component Clustering was selected. Implementer(s): Russell Duhon Integrator(s): Russell Duhon Input Parameters: Number of top clusters: 10 3 clusters found, generating graphs for the top 3 clusters. .......... 49
Network Visualization: Color/Size Coding by Degree .......... Node Degree was selected. Documentation: https://nwb.slis.indiana.edu/community/?n=AnalyzeData.NodeDegree .......... 50