Download
1 / 27
270 likes | 356 Views
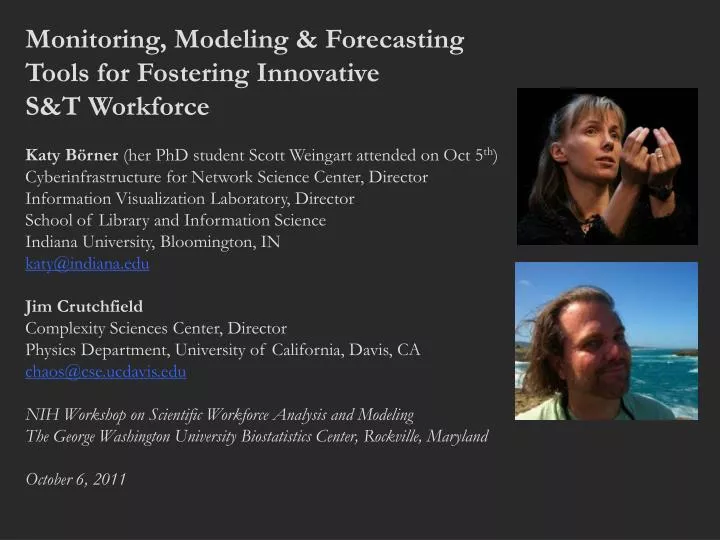
Monitoring, Modeling & Forecasting Tools for Fostering Innovative S&T Workforce Katy Börner (her PhD student Scott Weingart attended on Oct 5 th ) Cyberinfrastructure for Network Science Center, Director Information Visualization Laboratory, Director

E N D
Monitoring, Modeling & Forecasting Tools for Fostering Innovative S&T Workforce Katy Börner(her PhD student Scott Weingart attended on Oct 5th) Cyberinfrastructure for Network Science Center, Director Information Visualization Laboratory, Director School of Library and Information Science Indiana University, Bloomington, IN katy@indiana.edu Jim Crutchfield Complexity Sciences Center, Director Physics Department, University of California, Davis, CA chaos@cse.ucdavis.edu NIH Workshop on Scientific Workforce Analysis and Modeling The George Washington University Biostatistics Center, Rockville, Maryland October 6, 2011
Project Description This project aims to develop monitoring, modeling, and forecasting approaches and tools for fostering an innovative science and technology workforce. Large scale datasets of scholarly activity including funding, publications, patents, and job openings among others will be analyzed and modeled. Existing models in statistical mechanics, nonlinear dynamics, network theory, and evolutionary theory will be applied, synthesized and extended to capture the structure and dynamics of the US scientific workforce. We are particularly interested to model individual and team ‘diversity’ (in gender, ethnicity, disciplinarity, and institutions–academic, industry, government) as a main predictor of innovation and the spontaneous emergence of communities of innovation. The models and their analytical predictions will be rigorously validated using empirical data and applied to forecast implications of different policy interventions and funding decisions. The most predictive computational models that best address science policy maker needs will be made available as a custom tool to support development and management of interventions and training programs, to guide the collection and analysis of data necessary for program design and management, and to communicate general trends to relevant stakeholders.
Modeling Science Dynamics using • multi-level, • mixed methods, and • multi-perspective models Katy Börner, Kevin W. Boyack, StašaMilojević, Steven Morris. (2011) An introduction to modeling science: Basic model types, key definitions, and a general framework for the comparison of process models. In Scharnhorst, Andrea, Börner, van den Besselaar (Eds) Models of Science Dynamics. Springer Verlag.
Descriptive Models of Science • Detect advances of scientific knowledge via "longitudinal mapping" (Garfield, 1994). • Synthesis of specialty narratives from co-citation clusters (Small, 1986). • Identify cross-disciplinary fertilization via "passages through science" (Small, 1999, 2000). • Understand scholarly information foraging (Sandstrom, 2001). • Knowledge discovery in un-connected terms (Swanson & Smalheiser, 1997). • Determine areas of expertise for specific researcher, research group via "invisible colleges" (note that researchers self definition might differ from how field defines him/her) (Crane, 1972). • Identify profiles of authors, also called CAMEOS, to be used to for document retrieval or to map an author’s subject matter and studying his/her publishing career, or to map the social and intellectual networks evident in citations to and from authors and in co-authorships (White, 2001).
Descriptive Models of Science cont. • Identification of scientific frontiers http://www.science-frontiers.com/. • ISI's Essential Science Indicatorshttp://essentialscience.com/ • Import-export studies (Stigler, 1994). • Evaluation of 'big science' facilities using 'converging partial indicators' (Martin, 1996; Martin & Irvine, 1983). • Input (levels of funding, expertise of scientists, facilities used) - output (publications, patents, Nobel prices, improved health, reduced environment insults, etc. - influenced by political, economic, financial, and legal factors studies (Kostroff & DelRio, 2001). • Determine influence of funding on research output (Boyack & Borner, 2002). • How to write highly influential paper (van Dalen & Henkens, 2001).
Process Models of Science Can be used to predict the effects of • Large collaborations vs. single author research on information diffusion. • Different publishing mechanisms, e.g., E-journals vs. books on co-authorship, speed of publication, etc. • Supporting disciplinary vs. interdisciplinary collaborations. • Many small vs. one large grant on # publications, Ph.D. students, etc. • Resource distribution on research output. • … In general, process model provide a means to analyze the structure and dynamics of science -- to study science using the scientific methods of science as suggested by Derek J. deSolla Price about 40 years ago.
Council for Chemical Research. 2009. Chemical R&D Powers the U.S. Innovation Engine. Washington, DC. Courtesy of the Council for Chemical Research. 7
Data: Scholarly Database VIVO National Researcher Network 8
Scholarly Database at Indiana Universityhttp://sdb.wiki.cns.iu.edu Supports federated search of 25 million publication, patent, grant records. Results can be downloaded as data dump and (evolving) co-author, paper-citation networks. Register for free access at http://sdb.cns.iu.edu
Scholarly Database at Indiana Universityhttp://sdb.wiki.cns.iu.edu
Since March 2009:Users can download networks: - Co-author - Co-investigator - Co-inventor - Patent citationand tables for burst analysis in NWB.
VIVO: A Semantic Approach to Creating a National Network of Researchers (http://vivoweb.org) • Semantic web application and ontology editor originally developed at Cornell U. • Integrates research and scholarship info from systems of record across institution(s). • Facilitates research discovery and cross-disciplinary collaboration. • Simplify reporting tasks, e.g., generate biosketch, department report. Funded by $12 million NIH award. Cornell University: Dean Krafft (Cornell PI), Manolo Bevia, Jim Blake, Nick Cappadona, Brian Caruso, Jon Corson-Rikert, Elly Cramer, Medha Devare, John Fereira, Brian Lowe, Stella Mitchell, Holly Mistlebauer, Anup Sawant, Christopher Westling, Rebecca Younes. University of Florida: Mike Conlon (VIVO and UF PI), Cecilia Botero, Kerry Britt, Erin Brooks, Amy Buhler, Ellie Bushhousen, Chris Case, Valrie Davis, Nita Ferree, Chris Haines, Rae Jesano, Margeaux Johnson, Sara Kreinest, Yang Li, Paula Markes, Sara Russell Gonzalez, Alexander Rockwell, Nancy Schaefer, Michele R. Tennant, George Hack, Chris Barnes, Narayan Raum, Brenda Stevens, Alicia Turner, Stephen Williams. Indiana University: Katy Borner (IU PI), William Barnett,Shanshan Chen, Ying Ding, Russell Duhon, Jon Dunn, Micah Linnemeier, Nianli Ma, Robert McDonald, Barbara Ann O'Leary,Mark Price, Yuyin Sun, Alan Walsh, Brian Wheeler, Angela Zoss.Ponce School of Medicine: Richard Noel (Ponce PI), Ricardo Espada, Damaris Torres.The Scripps Research Institute: Gerald Joyce (Scripps PI), Greg Dunlap, Catherine Dunn, Brant Kelley, Paula King,Angela Murrell, Barbara Noble, Cary Thomas, Michaeleen Trimarchi.Washington University, St. Louis: Rakesh Nagarajan (WUSTL PI), Kristi L. Holmes, Sunita B. Koul, Leslie D. McIntosh.Weill Cornell Medical College: Curtis Cole (Weill PI), Paul Albert, Victor Brodsky, Adam Cheriff, Oscar Cruz, Dan Dickinson, Chris Huang, Itay Klaz, Peter Michelini, Grace Migliorisi, John Ruffing, Jason Specland, Tru Tran, Jesse Turner, Vinay Varughese.
Temporal Analysis (When) Temporal visualizations of the number of papers/funding award at the institution, school, department, and people level 14
Topical Analysis (What) Science map overlays will show where a person, department, or university publishes most in the world of science. (in work) 15
Network Analysis (With Whom?) Who is co-authoring, co-investigating, co-inventing with whom? What teams are most productive in what projects? 16
http://nrn.cns.iu.edu Geospatial Analysis (Where) Where is what science performed by whom? Science is global and needs to be studied globally. (in work)
Börner, Katy. (March 2011). Plug-and-Play Macroscopes. Communications of the ACM, 54(3), 60-69. Video and paper are at http://www.scivee.tv/node/27704 20
http://sci2.cns.iu.edu http://sci2.wiki.cns.iu.edu 22
OSGi/CIShell powered tool with NWB plugins and many new scientometrics and visualizations plugins. Börner, Katy, Huang, Weixia (Bonnie), Linnemeier, Micah, Duhon, Russell Jackson, Phillips, Patrick, Ma, Nianli, Zoss, Angela, Guo, Hanning & Price, Mark. (2009). Rete-Netzwerk-Red: Analyzing and Visualizing Scholarly Networks Using the Scholarly Database and the Network Workbench Tool. Proceedings of ISSI 2009: 12th International Conference on Scientometrics and Informetrics, Rio de Janeiro, Brazil, July 14-17 . Vol. 2, pp. 619-630. Sci2 Tool – “Open Code for S&T Assessment” GUESS Network Vis Sci Maps Horizontal Time Graphs
Sci2 Tool Geo Maps Circular Hierarchy
References Börner, Katy, Chen, Chaomei, and Boyack, Kevin. (2003). Visualizing Knowledge Domains. In Blaise Cronin (Ed.), ARIST, Medford, NJ: Information Today, Volume 37, Chapter 5, pp. 179-255. http://ivl.slis.indiana.edu/km/pub/2003-borner-arist.pdf Shiffrin, Richard M. and Börner, Katy (Eds.) (2004). Mapping Knowledge Domains. Proceedings of the National Academy of Sciences of the United States of America, 101(Suppl_1). http://www.pnas.org/content/vol101/suppl_1/ Börner, Katy, Sanyal, Soma and Vespignani, Alessandro (2007). Network Science. In Blaise Cronin (Ed.), ARIST, Information Today, Inc., Volume 41, Chapter 12, pp. 537-607. http://ivl.slis.indiana.edu/km/pub/2007-borner-arist.pdf Börner, Katy (2010) Atlas of Science. MIT Press. http://scimaps.org/atlas Scharnhorst, Andrea, Börner, Katy, van den Besselaar, Peter (2011) Models of Science Dynamics. Springer Verlag. 26
All papers, maps, tools, talks, press are linked from http://cns.iu.edu CNS Facebook: http://www.facebook.com/cnscenter Mapping Science Exhibit Facebook: http://www.facebook.com/mappingscience 27