Download
1 / 29
290 likes | 547 Views
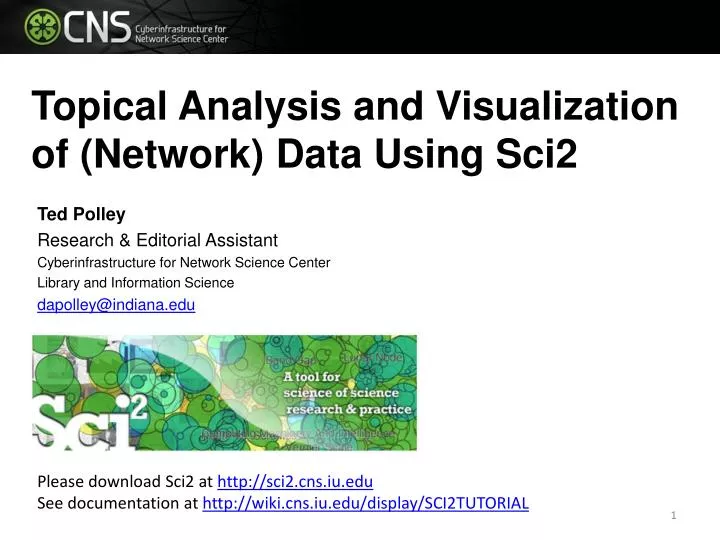
Topical Analysis and Visualization of (Network) Data Using Sci2. Ted Polley Research & Editorial Assistant Cyberinfrastructure for Network Science Center Library and Information Science dapolley@indiana.edu. Please download Sci2 at http://sci2.cns.iu.edu

E N D
Topical Analysis and Visualization of (Network) Data Using Sci2 Ted Polley Research & Editorial Assistant Cyberinfrastructure for Network Science Center Library and Information Science dapolley@indiana.edu Please download Sci2 at http://sci2.cns.iu.edu See documentation at http://wiki.cns.iu.edu/display/SCI2TUTORIAL
Overview This hands-on session introduces topical analysis and visualization of network data. Specifically, we will use the Sci2 tool to extract co-word occurrence networks and to generate science map overlays.
Introduction to Topic Analysis The topic or semantic coverage of a unit of science can be derived from the text associated with it. Topical aggregations (e.g., over journal volumes, scientific disciplines, or institutions) are common. Topical analysis extracts the set of unique words or word profiles and their frequency from a text corpus. Stop words, such as 'the' and 'of' are removed, and stemmingcan be applied. Stemming example: fishing, fished, fish, and fisher to the stem “fish”
Introduction to Network Analysis What is a Network? Graph – network visualized Nodes (vertices) Edges (links)
Introduction to Network Analysis • Graph Metrics - Nodes • Betweenness Centrality – number of shortest paths a node sits between • Degree • Isolates
Introduction to Network Analysis • Graph Metrics - Edges • Shortest paths – shortest distance between two nodes • Weight – strength of tie • Directionality – is the connection one-way or two-way (in-degree vs. out-degree)? • Bridge – deleting would change structure
Extracting Word Co-Occurrence Network from SDB Data Word Co-Occurrence Network from the abstracts of articles from MEDLINE with the keyword “mesothelioma” in the title…
Extracting Word Co-Occurrence Network from SDB Data If you have registered for the Scholarly Database then go to http://sdb.cns.iu.edu and login… If you do not have an account type in nwb@indiana.edu and nwb for the password
Extracting Word Co-Occurrence Network from SDB Data Do a keyword search in Title for “mesothelioma” and check MEDLINE…
Extracting Word Co-Occurrence Network from SDB Data We will only download the first 1000 results to minimize the runtime for the algorithms used in this workflow. Make sure to check MEDLINE master table since that will have all of the bibliographic data we need for this analysis. Your download limit will initially capped at 2000 records at a time. To increase this limit, please email cns-sdb-dev-l@iulist.indiana.edu
Extracting Word Co-Occurrence Network from SDB Data Save the file somewhere on your computer for use later in this tutorial…
Extracting Word Co-Occurrence Network from SDB Data Extract Word Co-Occurrence The topic similarity of basic and aggregate units of science can be calculated via an analysis of the co-occurrence of words in associated texts. Units that share more words in common are assumed to have higher topical overlap and are connected via linkages and/or placed in closer proximity. Extract Word Co-Occurrence Network creates a weighted network where each node is a word and edges connect words to each other, where the strength of an edge represents how often two words occur in the same body of text together. This algorithm is a shortcut for extracting a directed network using Extract Directed Network, and then performing bibliographic coupling using Extract Reference Co-Occurrence (Bibliographic Coupling) Network.
Extracting Word Co-Occurrence Network from SDB Data Open Sci2 and load the MEDLINE_master_table.csv file as a Standard CSV file…
Extracting Word Co-Occurrence Network from SDB Data Normalize the titles by running Preprocessing > Topical > Lowercase, Tokenize, Stem, and Stopword Text and select “Abstract”…
Extracting Word Co-Occurrence Network from SDB Data Run Extract Word Co-Occurrence Network and set the parameters as shown below…
Extracting Word Co-Occurrence Network from SDB Data To see more information about your network run Analysis > Networks > Network Analysis Toolkit…
Extracting Word Co-Occurrence Network from SDB Data The results from Network Analysis Toolkit show that there are 579 isolated nodes… This graph claims to be undirected. Nodes: 4846 Isolated nodes: 1000 Node attributes present: label, references Edges: 499196 No self loops were discovered. No parallel edges were discovered. Edge attributes: Did not detect any nonnumeric attributes. Numeric attributes: minmaxmean weight 12421.7084 This network seems to be valued. Average degree: 206.0239 This graph is not weakly connected. There are 1001 weakly connected components. (1000 isolates) The largest connected component consists of 3846 nodes. Did not calculate strong connectedness because this graph was not directed. Density (disregarding weights): 0.0425 Additional Densities by Numeric Attribute
Extracting Word Co-Occurrence Network from SDB Data Delete the isolate nodes by running Preprocessing > Networks > Delete Isolates
Extracting Word Co-Occurrence Network from SDB Data Apply Visualization > Networks > DrL(VxOrd) and words that are similar will be plotted relatively close to each other. Set the parameters to those shown below…
Extracting Word Co-Occurrence Network from SDB Data Laying out the network with Drl (VxOrd) may take some time, but once the algorithm is complete you will want to keep only the strongest edges, so select the “Laid out with DrL” and run Preprocessing > Networks > Extract Top Edgesusing the parameters shown below…
Extracting Word Co-Occurrence Network from SDB Data Once edges have been removed, the network "top 1000 edges by weight" can be visualized by running Visualization > Networks > GUESS…
Extracting Word Co-Occurrence Network from SDB Data In order to make use of the DrL (VxOrd) force directed layout we applied, we need to change to the interpreter at the bottom of the screen and type in the following commands…
Extracting Word Co-Occurrence Network from SDB Data Note, GUESS will not necessarily display the graph in the middle of the screen, you may have to scroll around the screen to find the graph.
Overlaying ISI Data on the Map of Science via Journals The Map of Science is a visual representation of 554 sub-disciplines within 13 disciplines of science and their relationships to one another, shown as points and lines connecting those points respectively. Over top this visualization is drawn the result of mapping a dataset's journals to the underlying sub-discipline(s) those journals contain. Mapped sub-disciplines are shown with size relative to the number matching journals and color from the discipline. For more information on maps of science, see http://mapofscience.com As of the Sci2 v1.0 alpha release there is a plugin for Sci2 that allows users to visualize their own data overlaid on the Map of Science
Overlaying ISI Data on the Map of Science via Journals Load the FourNetSciResearchers.isi file in the ISI flat format…
Overlaying ISI Data on the Map of Science via Journals To visualize dataset overlaid on the Map of Science run Visualization > Topical > Map of Science via Journals
Overlaying ISI Data on the Map of Science via Journals The journals titles are used to determine which records fit into what subdiscipline. You can view the journal titles found and those not found from the data manager of Sci2. A single journal can belong to more than one subdisciplineand thus so can the record associated with that journal. So the circle sizes are proportional to the number of fractionally assigned records.