Download
1 / 44
440 likes | 531 Views
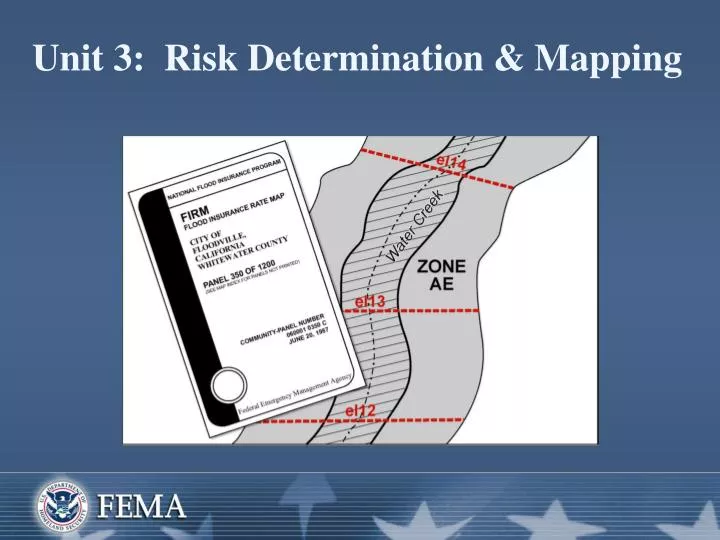
Unit 3: Risk Determination & Mapping. Meet Mr. and Mrs. Jones. Jim and Carrie Jones have owned a lot on Ireland Creek for years. As they near retirement, Jim and Carrie are planning to build a small cottage, their dream home, on the lot.

E N D
Meet Mr. and Mrs. Jones • Jim and Carrie Jones have owned a lot on Ireland Creek for years. • As they near retirement, Jim and Carrie are planning to build a small cottage, their dream home, on the lot. • The Flood County Building and Zoning Department advised them to check on floodplain requirements.
What Happens Next? • Is the site at risk of flooding? • How will you find out? • If the site is at risk, what requirements apply? • How will you monitor the construction?
Objectives • At the end of this unit, you should be able to: • Describe how watershed processes and the forces of water relate to flood risk. • Use available technology to determine the location of property in the floodplain. • Use FIS and base maps to identify the: • Floodway, • Base Flood Elevation (BFE), and • Flood zone.
Watershed Processes • Rainfall intensity and duration • Steepness or slope • Size or area • Land cover • Ability of ground cover to absorb water • Obstructions along watercourses(e.g., culverts, bridges, etc.) that impede flow
In-class activity Activity: Risk Determination Terminology • Risk determination terms are basic to using flood maps and Flood Insurance Studies. • Terms and definitions are in the glossary at the end of your Participant Manual. • Work at your tables to match terms and definitions.
Maps and Flood Studies • Types of Maps and Studies: • Community Flood Insurance Study (FIS) with Flood Insurance Rate Map (FIRM) • Countywide FIS and FIRM • Prior to 1985: FIS with FIRM and Flood Boundary and Floodway Map (FBFM) • Early years: Flood Hazard Boundary Map (FHBM)
FIRMs • Identify flood hazard areas. • Show floodplains with Base Flood Elevations (BFEs) and without BFEs. • May show areas within the regulatory floodway. • May show community landmarks. • Divide the study area into zones used to establish actuarial insurance rates.
In-class activity Open Your Flood County Packet • Contents: The Flood County FIS, map index, and map panels. • Find map panel 40 and unfold it. • Locate the “Legend” section on the upper right. • Zone A = Riverine and lake areas. • Zone V = Coastal areas. • Find Zones AE, AO, and VE on the map in Panel 40. How does the Legend describe these zones? • Notice how the map shows extensive information on risk in some areas and very little in others.
In-class activity Decoding the Map • What are the shades/patterns for: • SFHAs? • Floodway areas? • Zones X and D? • Undeveloped coastal barriers? • What type of boundary lines show: • Flood Boundary? • Floodway Boundary? • Boundary Dividing Special FloodHazard Zones?
In-class activity Decoding the Map • What type of line/symbol shows the: • Base Flood Elevation? • Cross-section lines? [Note: Cross-section lines are usually in floodways.] • According to the Approximate Scale, one inch on Panel 40 = how many feet? • Unfold Panel 38. 1 inch = how many feet on Panel 38? (Note: The scale differs depending on the map panel.)
In-class activity Open FEMA 258 • Pages 5-15 cover how to decode map indexes and content. • Page 13 has full definitions of Flood Insurance Risk Zone Designations that you may want to mark with a self-stick note. • Note: Designations A1-30 have been replaced by Zone AE, and V1-30 by Zone VE.
Using a FIRM: Steps • 1. Find the correct panel. • 2. Find the general location of the property. • 3. Find the specific location of the property. • 4. Identify the flood insurance risk zone designation.
In-class activity Activity: Steps To Read a Flood Map • Turn to Page 16 of FEMA 258. • You are considering buying a new home on Water Street in Sampleville. • Pages 16-18 lead you step by step to find out: • If this house is in the SFHA. • The insurance risk zone designation. • Work individually to complete the Steps To Read a Flood Map activity in your Participant Manual.
In-class activity Activity: Mapping Practice Problems • The instructor will assign addresses from the table on page 3-18 in your Participant Manual to your group. The table provides map panels for all addresses. • Work together to locate address vicinity and exact location on the map panels. • As in real life, some addresses cannot be located. Ask an instructor for more information. • Complete ONLY the Panel, Flood Zone, and In Floodway? columns for the addresses.
Using GIS • Does your jurisdiction use GIS? • How does use of GIS affect how you make floodplain determination? • GIS use will increase, especially as the Map Modernization program proceeds. • Paper maps will continue in use for the near future, but eventually most communities will be using GIS maps.
Map Modernization Program • Local-level meetings are being held to determine needs. • Each county will receive a pre-determined portion of Map Mod funds. • Prepare by deciding beforehand exactly what mapping products to request.
In-class activity Turn to the FIS Table of Contents • Area Studied reviews the community’s flooding problems. • Engineering Methods give flood discharge data. • Floodplain Management Applications relate the FIS to FIRM boundaries/risk zones. • Insurance Applications describe zone designations. • Flood Profile Tables are attached at the end. • Take several minutes to leaf through the FIS.
FIS Contents: Summary • Appraisal of community’s flooding problems • Flood discharge data • 1% chance floodplain boundaries • Flood hazard risk zones • Floodplain management and flood insurance applications • Exhibits: Flood Profiles, FIRM Map Index, FIRM Map Panels
Use of Terms • What is the relationship between the 100-year floodplain boundaries and the 1-percent chance boundaries?
100-YEAR FLOODPLAIN FLOODWAY FRINGE FLOODWAY SURCHARGE Floodway Schematic FLOODWAY+ FLOODWAY FRINGES = FLOODPLAIN SURCHARGE NOT TO EXCEED 1.0 FOOT
In-class activity Decoding the Floodway Schematic • Turn to Figure 4, Page 18 in the FIS. • Find the floodway, floodway fringe, and 100-year (1-percent chance) floodplain. • Find the flood elevation before encroachment (dotted line A-B). • Find the flood elevation after fill (shown as a shaded area) encroaches on the floodway (solid line C-D). • Surcharge (shown as pale blue on the visual) cannot exceed 1 foot (“No Rise” concept).
In-class activity Understanding Cross-Sections • Unfold map panel 38 and find the Rocky River. • What cross-sections are included on panel 38? • Each cross-section matches a survey location in the Flood Insurance Study.
In-class activity Using the Floodway Data Table • Turn to page 17 in the FIS, Floodway Data Table. • Find cross-section C in the left-hand column. • How many feet above the county boundary is cross-section C? • What is the floodway width at cross-section C? • What is the regulatory and without floodway BFE at cross-section C?
In-class activity NGVD • Note that in the final column of the Floodway Data Table, BFE is shown in Feet NGVD. • What does this acronym mean? (Hint: See the middle of FIS page 15.)
In-class activity Flood Profile Charts • Turn to the flood profile charts at the end of the FIS. • The first chart is for Cobb Creek, and remaining charts are for the Rocky River. • Unfold Flood Profile 02P for the Rocky River. • Find cross-hatching that shows the streambed. • Note the set of four lines showing elevations for different flood events. • Next, you will practice using the FIS to find data.
In-class activity Activity: Flood Profiles • Purpose: Relate the flood elevations on the Floodway Data Table to Flood Profile cross-sections. • You will use the Floodway Data Table and Flood Profile. • First, find the points on the Flood Profile for cross-sections A, B, and C. • Answer the questions on page 3-29 of the Participant Manual.
In-class activity Activity: Matching Locations • Purpose: Relate cross-sections on the FIRM to the Floodway Data Table and to Flood Profile cross-sections. • Find cross-sections A and C on: • FIRM map panel 38. • The Floodway Data Table (FIS page 17). • Flood Profile information (FIS Flood Profile 02P). • Work individually to complete the questions.
In-class activity Lake Areas and V Zones • Unfold map panel 40. • Note AE zones surrounding several lakes. • What do the diagonal lines in the lower right corner indicate? • What do the white lines in the lower right section of the map represent?
In-class activity Stillwater and Wave Elevations • Turn to FIS page 8 and look at Table 2. • Which flooding sources are on Panel 40? • Note that in addition to stillwater elevations, the Atlantic Ocean is subject to storm surges. • Wave heights during storm surges are analyzed along transects (cross-section lines) along a coast.
In-class activity Transects • Turn to FIS page 11 and look at Figure 2. • The lines marked 1, 2, and 3 are the locations of the transects along the Atlantic coast. • Each transact is a cross-section from a point on the shoreline to a point inland. • Turn to FIS pages 12-13 and look at Tables 4 and 5. • These tables provide detailed data for each transect location.
Transect Schematic • After analyzing wave heights along each transect, wave elevations were interpolated between transects. Various source data were used in the interpolation, including topographic maps, beach profiles, aerial photos, and engineering judgment. Controlling features affecting the elevations were identified and considered in relation to their positions at a particular transect and their variation between transects.
In-class activity Transect Schematic Features • Turn to FIS page 14 and look at Figure 3. • Note that the text under Figure 3 is repeated on the visual. • On Figure 3, find: • Mean sea level. • 100-year stillwater elevation. • Base flood elevation including wave effects. • What marks the division between the V zone and the A zone of the transect?
In-class activity Activity: Transect Data • Purpose: Relate transect data to coastal flood zones and base flood elevations. • Turn to the Transect Data on page 3-37 in your Participant Manual. • Work within your table group. • Answer the activity questions, using: • Map panel 40. • Figure 2, FIS page 11. • Table 5, FIS page 13.
In-class activity BFEs From FIS Tables • Unfold map panel 40 and find South Lake. • What BFE is shown for South Lake? • Now refer to FIS page 8, Table 2. • What is the 100-year elevation for South Lake in the FIS? • Point: FIS BFEs are more precise.
In-class activity BFEs From Flood Profiles • Turn to Flood Profile 02P at the back of the FIS. • Find Oaks Drive on the Profile. • What is the 100-year elevation for Oaks Drive? (Remember: 1 square = .5 feet.) • The map panel rounds the elevation to 11 feet. • Point: Always use available Flood Profiles to estimate BFEs in riverine areas.
In-class activity Activity: Mapping Practice Problems, Part 2 • You will now determine BFEs for the addresses you located in Mapping Practice Problems, Part 1. • Turn back to the Part 1 chart on page 3-18 in your Participant Manual. • Which addresses will not have BFEs in the FIS? • Use the tables and flood profiles in the FIS to determine the BFEs to the nearest tenth of a foot for the remaining addresses.
New FIS: Steps • 1. Conduct Scoping Meeting: FIS scope, data collection, development of hydrology and hydraulics analyses. • 2. Coordinate with community to prepare preliminary FIS. • 3. Conduct periodic meetings to review draft study results.
New FIS: Steps • 4. Conduct final CCO Meeting. • 5. Allow 90-day appeal period. • 6. Send Letter of Final Determination (FEMA). • 7. Pass compliant ordinance within 6 months from the Final Letter of Determination (community).
No Adverse Impact: Opportunities • Monitor watershed run-off changes; the FIS and FIRM may no longer be accurate. • Monitor major development in Approximate A Zones. • Consider a stricter standard than the one-foot rise in BFE in the floodway corridor.