1 / 73

Stem-and-Leaf P lot .

Learn how to construct a stem-and-leaf plot, a tool for displaying data. Explore the statistics of 40 students and understand the importance of accurate data representation.

burnley
Download Presentation

Stem-and-Leaf P lot .

An Image/Link below is provided (as is) to download presentation Download Policy: Content on the Website is provided to you AS IS for your information and personal use and may not be sold / licensed / shared on other websites without getting consent from its author. Content is provided to you AS IS for your information and personal use only. Download presentation by click this link. While downloading, if for some reason you are not able to download a presentation, the publisher may have deleted the file from their server. During download, if you can't get a presentation, the file might be deleted by the publisher.

E N D

Presentation Transcript


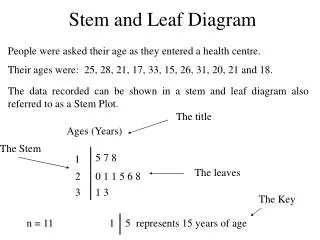
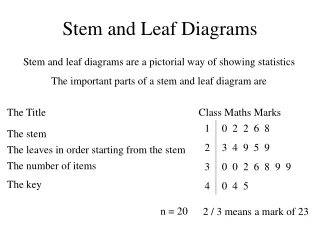
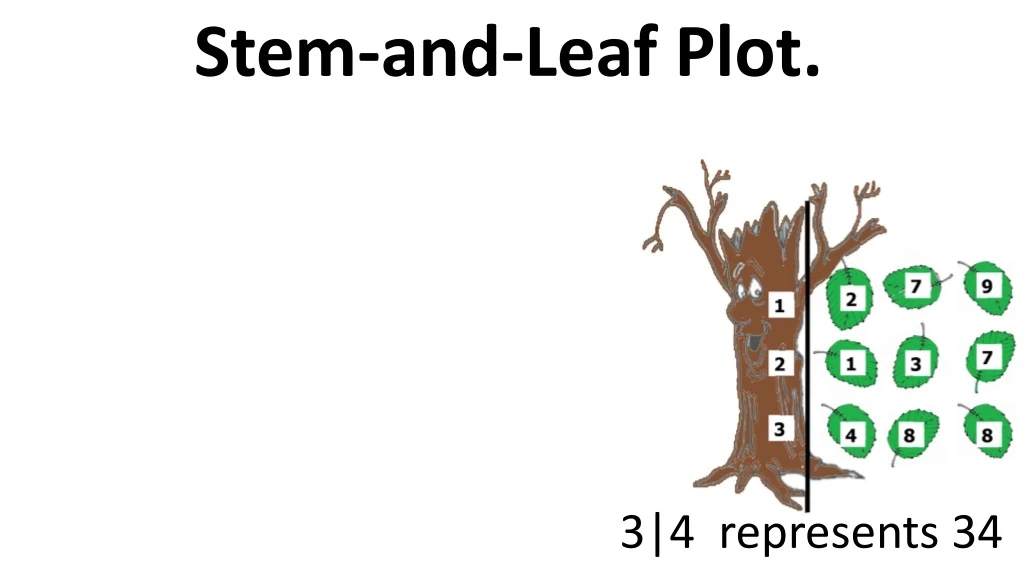
  1. Stem-and-Leaf Plot. 3|4 represents 34

  2. A unique way of displaying data uses a tool called a stem-and-leaf-plot.

  3. Use the data showing statistics for 40 studentsto construct a stem-and-leaf plot.

  4. Benjamin Disraeli, Queen Victoria’s prime minister, stated that there are “lies, damn lies, and statistics.”

  5. The problem is not that statistics lies, but rather that liars use statistics. There are three kinds of lies, lies, damn lies and statistics.

More Related