Download
1 / 19
190 likes | 351 Views
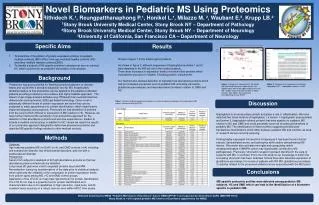
Determine what soil nutrients are present and how much Determine what soil organisms are present and how many Why????. METHODS!!!. relationship to soil fertility, productivity, and biogeochemical cycling of elements. HOW????. 1. Sampling. X X X X X X X

E N D
Determine what soil nutrients are present and how much • Determine what soil organisms are present and how many • Why???? METHODS!!! relationship to soil fertility, productivity, and biogeochemical cycling of elements HOW???? 1
Sampling X X X X X X X X X X X X X X X X X X X X X X X X X X X X X X X X X X X X X X X X X X • Exploratory • Statistical • systematic 42 samples = $$$ 2
Sampling • Statistical • systematic • random X X X X X X X 3 samples = representative??? or 14 samples = ok??? X X X X X X X 3
Sampling X • Statistical • systematic, • random, • stratified random X X X X X X X 11 samples = better/$??? X X X 4
Sampling • Number of samples? # = ((t value2) x (sample variance)) / (sample mean - population mean)2 • Composite samples • can sample more but not enough $$$ for analysis/total samples so composite samples to better represent area and is cheaper 5
Sampling • Bulk vs specific (eg average vs nonrhizosphere or rhizosphere or rhizoplane or ….) • Substrate (eg, forest floor, A horizon, decomposing wood, etc) 6
Sampling • Depth– standardized between treatments! (some organisms/nutrients found at specific depths due to eg light, moisture, roots, ….) • Time- organisms active, dead, nonactive (season, related to plant growth, time of day, ….) • Storage & Transportation • air dry, moist, wet, frozen, ….. • Soil cans, jars, paper bags, plastic bags….. 7
Some factors to consider for a site (advantages or disadvantages-restrictions): • Aspect (in N hemisphere facing south so warmer/drier or north facing so colder/wetter?) • Slope (steepness?) • Soil texture - aeration, moisture retention, percolation, compactability • Soil depth - sufficient rooting depth, ability to excavate eg bedrock, or ??? • Soil pH - correct pH for plants, or mobility of nutrients, or soil animals • Air/Soil Temperature - deviations/avgs appropriate for plants/animals, seasonality, ? • Soil Productivity - ok for plants, need supplements? Eg Fertilizer, Organic Matter, Lime, etc • Pollution - air, water, soil??? • Windy - ?? Tipover trees problem? • etc???? 8
Nitrogen (eg)content in soil horizon But need BD to calculate how much (content)! Eg, = 1.1g soil/cm3 N soil concentration = 0.3% (or 0.3g N/100g soil) = ( 0.3g N/100g soil) x (1.1g soil/cm2•cm) x 1kg/103g x 104cm2/m2 x 104m2/ha = = 0.33•108 kg N/105 ha•cm = 330 kg N/ha•1cm depth Nitrogen content in 10cm horizon = (330 kg N/ha•cm depth) x 10cm horizon = 3300 kg N/ha 9
Biomass/Productivity Calculation for different plants in the Pacific Northwest Equations for estimating biomass and leaf area of plants in the Pacific Northwest. (Gholz, HL, CC Grier, AG Campbell, and AT Brown. 1979. Research Paper 41, Forest Research Lab, School of Forestry, Oregon State University, Corvallis, Oregon) 10
Biomass Calculation for Pseudosuga menziesii (Douglas-fir): ln Y = -2.8462 + 1.7009 ln X Y = Total foliage biomass (including petioles) in kg X = DBH where DBH is in ‘cm’ ln Y = -3.6941 + 2.1382 ln X Y = Live branch biomass in kg X = DBH where DBH is in ‘cm’ ln Y = -3.529 + 1.7503 ln X Y = Dead branch biomass in kg X = DBH where DBH is in ‘cm’ ln Y = -3.0396 + 2.5951 ln X Y = Stem wood biomass(w/o bark) in kg X = DBH where DBH is in ‘cm’ ln Y = -4.3103 + 2.4300 ln X Y = Stem bark biomass in kg X = DBH where DBH is in ‘cm’ ln Y = -4.6961 + 2.6929 ln X Y = Coarse root biomass in kg X = DBH where DBH is in ‘cm’ ln Y = -5.7265 + 2.039 ln X Y = New foliage biomass in kg X = DBH where DBH is in ‘cm’ 11
Biomass Calculation for Alnus rubra(red alder): Y = 0.02 + 1.60X – 0.0005X2 Y = Stem (bark+wood) biomass in kg X = (DBH2 x height/100) where DBH is in ‘cm’ and height is in ‘m’ Y = 0.02 + 2.09X – 0.0015X2 Y = Total aboveground wood+bark biomass in kg X = (DBH2 x height/100) where DBH is in ‘cm’ and height is in ‘m’ Y = 0. 1 + 0.48X – 0.0005X2 Y = Coarse root biomass in kg X = (DBH2 x height/100) where DBH is in ‘cm’ and height is in ‘m’ Y = 0.5124 + 0.1298X Y = Total foliage biomass in kg X = (DBH2 x height/100) where DBH is in ‘cm’ and height is in ‘m’ 12
Biomass Calculation for a forest area: • Calculate the biomass for each tree using the allometric equations presented on your class web page in the lab & field section for each respective species (Douglas-fir & red alder). If a species equation is not listed, contact the instructor for the equations. Equations are listed for different components of the tree (eg, branches, total foliage, new foliage, stemwood, stemwood+bark, etc). The independent variables needed to estimate biomass components require DBH for both Douglas-fir and red alder and also height for the red alders. This will give a biomass of the tree component (eg, kg of stemwood/tree). • Sum the biomass of all the tree components for each tree depending upon the questions • (eg, total aboveground tree biomass = total foliage+branches+stemwood+bark). Then sum all the tree biomasses on the plot and divide it by the plot area to calculate the Biomass of trees (or tree components) per area (eg, kg/ha). This can be done within each ‘vigor’ category depending upon your questions. 13
To Calculate Productivity you need? Biomass 2007 – Biomass 2002 = eg = 5,000 kg/ha/ 5yr or divide by 5yrs to calculate average annual productivity for 5 yrs eg: = 1,000 kg/ha/yr 14
Measure Annual (or 5 yr) diameter increment (using tree cores) to estimate past DBHs 1) Core several (or all) trees at Breast Height of the species interested in determining diameter increments (growth) on each treatment plot. Make sure that the trees cored are well inside the plot (if possible) so that they represent the plot treatment. Also several cores should be taken from several sides of each tree and averaged as the trees sometimes have different growth increments on different sides (we probably won’t do that in our class but you should be aware of pros/cons). 15
Measure Annual (or 5 yr) diameter increment (using tree cores) to estimate past DBHs(cont’d) • 2) Preparation of the cores for measuring tree rings vary but one way involves • getting 1”x 2” x ~12” pieces of wood and cutting 2 parallel grooves along the length and on the top of the wood and each groove cut in about 1/2” from the edge of each side of the wood. The groove should be wide enough to lay a tree core in the groove so that it touches the bottom of the groove but narrow enough for the sides of the grooves to contact each side of the core, • lay the cores in the grooves with the bark intact and let air dry and make sure that you label the id information on the wood next to the core, • you can stack the pieces of wood on top of each other (bottom of one piece on the top of another) and use a rubber band to hold them together while they are air-drying (this keeps them from curling or contracting too much while they are drying), • after the cores are air-dry you can then glue the cores in with Elmers wood glue, • you can then sand the cores if you cannot see the rings very well and sometimes you find that some stains may make some tree species’ rings more visible. 16
Measure Annual (or 5 yr) diameter increment (using tree cores) to estimate past DBHs(cont’d) 3) You can then measure the tree ring increments with an accurate ruler (eg engineer’s ruler) and hand lens or microscope and an ocular or stage micrometer) or there are even some machines that can measure the ring increments (eg, digital positiometer, image analysis, etc). It is sometimes useful to measure the bark thickness as well. However the tree corer frequently compacts the bark (or you lose the bark while coring!) so it is always best to directly measure the bark thickness in the field when you core the tree. This can be done with a bark thickness gauge (several measurements should be taken around the tree at the high points of the bark not the valleys to simulate the bark thickness that would be relative to the diameter that the DBH tape would have been measuring. You can then average the bark thickness measured on each tree. 17
Measure Annual (or 5 yr) diameter increment (using tree cores) to estimate past DBHs(cont’d) 4) For our class you can then average the annual or 5yr increments (cm/yr or mm/yr) of similar species and treatments (because we core so few trees). This then gives the average radial growth (or ½ diameter growth) of that tree species for that time period relative to its treatment. If you want an annual bark increment, you could measure different tree diameters and determine the ratio of the bark thickness to tree DBH. You could then develop a regression equation to help estimate the bark thickness for each tree diameter or a bark increment. This of course isn’t as accurate as directly measuring each tree bark thickness. It is not uncommon to determine the annual increment for different diameter trees on the plot and then develop a regression equation to calculate annual radial (or diameter) increment by knowing its DBH. You can then quickly determine the increment for each tree that you have a DBH. We will just use the averaged increments and subtract that from the 2007 DBH to estimate the 2006 DBH (or ? DBH) depending upon what you want to estimate – last year’s DBH or next year’s DBH or the DBH 5yrs ago). We will also assume no bark thickness increment during that time period for ease of class calculations. 18
Productivity Calculation for forest: Now with the new 2006 DBH (?or 2002 for 5yrs?) you can follow the same procedures listed in the ‘Biomass 2007’ methods to calculate a biomass for 2006 per tree/plot. One can then subtract 2006 biomass from the 2007 biomass and the difference is related to tree productivity (kg/tree/yr or kg/tree/5yr). You can then sum the tree productivities in the plot and divide by the plot area to determine productivity (kg/ha/yr or some use Mg/ha/yr). Again this can be done by tree component or total, by tree vigor and/or species depending upon your questions. 19