Download
1 / 19
190 likes | 407 Views
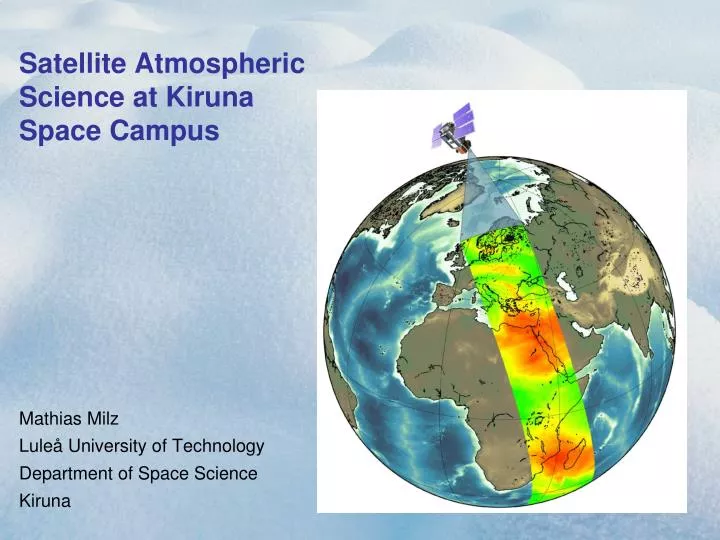
Satellite Atmospheric Science at Kiruna Space Campus. Mathias Milz Luleå University of Technology Department of Space Science Kiruna. The Satellite Atmospheric Science Group at Kiruna Space Campus. http://www.sat.ltu.se. Head of the group: Prof. Stefan Buehler

E N D
Satellite Atmospheric Science at Kiruna Space Campus Mathias Milz Luleå University of Technology Department of Space Science Kiruna
The Satellite Atmospheric Science Group at Kiruna Space Campus http://www.sat.ltu.se • Head of the group: Prof. Stefan Buehler • Currently:one Ex-jobb student • four PhD students (1-2 coming this fall) • three Assistant Professorsone software engineer • Young group (since fall 2006) • Close collaboration with IRF, Chalmers, Met Office (UK), Observatoire de Paris, SMHI, etc. • Focus:- atmospheric humidity- cloud ice- radiative transfer
Our Research Program Radiative Transfer Atmospheric Science New Satellite Sensors In Situ Measurements Stefan Buehler, Mathias Milz, www.sat.ltu.se 3
Motivation • Earth is getting warmer. • Climate predictions have large uncertainty. • (One) main reason: we do not know enough on clouds and humidity in the atmosphere. Best studied by satellite sensors. IPCC 4th assessment report, 2007 Figure 3.1. Annual anomalies of global land-surface air temperature (°C), 1850 to 2005, relative to the 1961 to 1990 mean for CRUTEM3 updated from Brohan et al. (2006). The smooth curves show decadal variations (see Appendix 3.A). The black curve from CRUTEM3 is compared with those from NCDC (Smithand Reynolds, 2005; blue), GISS (Hansen et al., 2001; red) and Lugina et al. (2005; green).
Sun Earth Why this Focus? • Humidity and clouds have strong influence on Earth radiation balance. • They create strong feedbacks, which can amplify or attenuate anthropogenic forcings, such as CO2 increase. • Currently one of the largest uncertainties in climate predictions. • Requires good data and modeling to achieve progress.
Radiative Transfer • ARTS - Atmospheric Radiative Transfer Simulator • Public domain • In collaboration with Chalmers • Microwave to IR • With scattering http://www.sat.ltu.se/arts Instrument simulation Radiation flux simulation Stefan Buehler, Mathias Milz, www.sat.ltu.se 6
Advanced Microwave Sounding Unit (AMSU) • On NOAA satellites. • Similar instruments on Metop and many other satellites. • Microwave temperature and humidity sensor. The Metop satellite, image: ESA.
AMSU-B Oxygen Upper tropospheric humidity Water vapor Buehler, S. A. and V. O. John (2005), A Simple Method to Relate Microwave Radiances to Upper Tropospheric Humidity,J. Geophys. Res., 110, D02110, doi:10.1029/2004JD005111.
Upper tropospheric humidity (UTH) climatology from AMSU data • Data processed from 2000 • SSM-T2 data since 1994 will be processed next Atmospheric Science Buehler, S. A., M. Kuvatov, V. O. John, M. Milz, B. J. Soden and J. Notholt (2008), An Upper Tropospheric Humidity Data Set From Operational Satellite Microwave Data,J. Geophys. Res., 113, D14110, doi:10.1029/2007JD009314.
Humidity in the Climate System:Comparing infrared and microwave measurements • Infrared: • Operational measurements since 1979 • Different instruments with different properties • Very sensitive to all clouds • Microwave: • Operational measurements since 1994 • Different instruments but all using the same spectral line • Insensitive to thin clouds • Thorough characterisation of infrared and microwave datasets is necessary to use the data.
The Role of Cirrus Clouds: Shortwave • Cirrus clouds reflect sunlight and thus increase the planetary albedo. • Cooling effect (AVHRR, Channel 1, 580-680nm, 25.1.2002, 13:30 UTC, Data Source: Met Office / Dundee Receiving Station)
The Role of Cirrus Clouds: Longwave • Cirrus clouds are radiatively cold and thus reduce the OLR. • Heating effect • Attention: grayscale is normally reversed for IR images so that clouds look white. • Net cooling or heating effect of cirrus depends on physical properties • Thickness • Opacity • Particles • … (AVHRR, Channel 4, 10.3-11.3μm, 25.1.2002, 13:30 UTC, Data source: Met Office / Dundee Receiving Station)
Discrepancies in Climate Model Ice Water Path Measurement Figures: Salomon Eliasson
New Satellite SensorsBetter measurements of ice clouds Figure: Sula Systems new ESA Mission Proposal “CloudIce” (Buehler et al., CIWSIR Mission Proposal, 2005, figure by Viju O. John) Stefan Buehler, Mathias Milz, www.sat.ltu.se 14
Imaging system for in-situ size and shape measurements Detector illumination CCD CCD Laser
Understanding Ice Clouds in the Climate System: Ice Particle In-Situ Imaging Satellite Observations Climate Models /aircraft/balloon/ground-based (e.g., EarthCARE, SMILES, SPIDER, ...) Annual mean ice water path from different climate models: Large discrepancies! Climate change Role of ice particles in radiative budget and hydrological cycle A priori assumptions on size, shape, volume of ice particles In-situ Measurements Instrument setup (Flash lamp) Optical fiber Focusing lens CCD • Ice Particle Measurements • Size, Shape, Volume, Concentration • Use measurements for • Study cloud processes (formation, growth, precipitation, ...) • Derive parameterizations of shape/size distributions for satellite retrievals and climate models Microscope objectives First implementation of in-situ ice crystal stereo imaging: - two microscope imaging probes triggered by detection system - allows reconstruction of 3D shape and improves size and volume estimate Slow ascend of balloon-borne stereo imager through cloud Captures of single-microscope imager
Summary • Atmospheric humidity in its different phases (gas, liquid, solid) is a key parameter for understanding and predicting the climate system. • Approached by our group in different ways:- satellite humidity measurements- satellite cloud ice measurements- in situ cloud ice measurements- development of new satellite and in situ instruments- radiative transfer • Questions?