Download

1 / 45
450 likes | 458 Views
This research paper explores the variability of tropospheric ozone on global to regional scales, highlighting the diverse sources of ozone precursors and the inadequate application of simple linear trends. The study recommends further investigation to understand the processes responsible for temporal and spatial changes in tropospheric ozone.

E N D
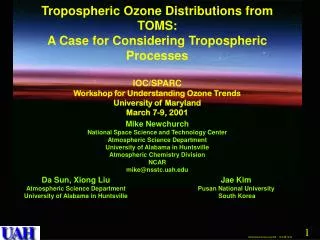
Tropospheric Ozone Distributions from TOMS:A Case for Considering Tropospheric ProcessesIOC/SPARCWorkshop for Understanding Ozone TrendsUniversity of MarylandMarch 7-9, 2001 Mike Newchurch National Space Science and Technology Center Atmospheric Science Department University of Alabama in Huntsville Atmospheric Chemistry Division NCAR mike@nsstc.uah.edu Da Sun, Xiong Liu Atmospheric Science Department University of Alabama in Huntsville Jae Kim Pusan National University South Korea
Thesis:Tropospheric Ozone is much more variable than Stratospheric Ozone • Time scales range from DIURNAL to DECADAL • Space scales range from URBAN to GLOBAL • Precursor sources are as varied as Industrial Pollution, Biomass Burning, Biogenic emissions (e.g., isoprene), and Lightning NOx. • Therefore, applying the concept of simple linear trends to changes in Tropospheric Ozone is inadequate.
Recommendation • IOC/SPARC should investigate Tropospheric Ozone on Global to Regional scales to assess the processes responsible for temporal and spatial changes. • We should be much better prepared to interpret new satellite measurement of tropospheric species.
MOZART Tropospheric Ozone --The MovieThe Distribution and Evolution of Tropospheric Ozone is veryDynamic • First, O3 in green on a horizontal slice at an altitude of ~6km, • with CO in red (the isosurface of 200 ppbv (parts per billion)). • NOx is added in blue (300 pptv (parts per trillion) isosurface). • The horizontal slice is then replaced with the isosurface of 30 ppbv O3, in green. • CO and NOx are products of combustion and high levels can be seen in both industrialized regions (North America, Europe and Asia) and biomass burning regions (Africa and South America). • Ozone is produced when CO, NOx and sunlight are all present. • Things to watch for: • The location of fires in South America and Africa changes with season. • CO concentrations become high near the North Pole during winter because there is not enough sunlight for the photochemical reactions that destroy it. • High levels of O3are seen in the upper troposphere in the tropics as a result of the convection of CO and other chemical species in thunderstorms, and the production of NOx from lightning.
Shirase Indian Ocean Ozone Plume:Biomass Burning and Lightningaffect the distribution of Ozone
Figure 4: (A) Ozone from MOZART at 8 km altitude for December 10 conditions (ppbv). The asterisks indicate the location of the Shirase ozone soundings. (B) Lightning NOx emissions from MOZART vertically integrated from the surface to the cloud top (kg-N/km2/month). [Hauglustaine et al., 2000] show how lighting NOx is critical for this ozone plume to result from Biomass Burning.
Figure 4 (continued): (C) NOx mixing ratio from MOZART at 8 km altitude (pptv). (D) Net ozone photochemical production (24-h average) calculated by MOZART at 8 km for December 10 (ppbv/day). [Hauglustaine et al., 2000] show how lighting NOx is critical for this ozone plume to result from Biomass Burning.
[DeCaria et al., 2000] show that lightning NOx is deposited in the upper troposphere where its effect can be far reaching. Figure 3: (A) NOx vertical profiles from MOZART for the source region over southern Africa for December 10 conditions (pptv). The location of the model profile sampling is indicated by the white box in Fig. 4. (B) NO profiles observed during TRACE-A over South America, South Atlantic and southern Africa. (C) Vertical distribution of NO observed during ELCHEM within and about convective clouds over New Mexico. (D) STERAO NO profiles observed in thunderstorms in Colorado.
[DeCaria et al., 2000] show that lightning NOx is deposited in the upper troposphere where its effect can be far reaching. Figure 6: Calculated ozone change (percent) associated with lightning NOx emissions for January and July conditions.
Tropical Tropospheric Ozone fromTOMS Observations and Ozonesondes:Tropospheric Ozone experiences significantSpatial and Temporal variation [Fishman and Brackett, 1997; Fishman et al., 1990; Hudson and Thompson, 1998; Jiang and Yung, 1996; Kim et al., 1996; Thompson and Hudson, 1999; Ziemke et al., 1998; Ziemke et al., 1996]
Figure 4: Sonde (Red); CCP (Org, Black); CCP (Adj, Blue) CCP vs. SHADOZ
Figure 4: Sonde (Red); CCP (Org, Black); CCP (Adj, Blue) CCP vs. SHADOZ (continued)
Scan Angle Methodfor Tropical Tropospheric Ozone from TOMS:Some Tropospheric Process have almost Escaped Notice Kim, J. H., et al., 2000] detect the North Equatorial African ozone increase in January-February with the Scan-angle technique.
Asian outflow [Bey et al., 2000; Gregory et al., 1997; Jaffe et al., 1997; Kaji et al., 1997] show the detectable effect of Asian pollution crossing the Pacific Ocean to the West coast of N. America.
Quantify the Magnitude of the Mass Flux from Stratospheric/Tropospheric Exchange
Ozonesonde climatology at Trinidad Head, Boulder, Huntsville, and Wallops show STE activity in the winter and spring.
Ozonesonde climatology at Trinidad Head, Boulder, Huntsville, and Wallops show STE activity in the winter and spring.
Lift-and-Cook ozone production affects regional ozone amounts.
Lift-and-Cook ozone production affects regional ozone amounts.
STE measurement experiments with meteorological analysis provide a method of quantifying mass flux
STE measurement experiments with meteorological analysis provide a method of quantifying mass flux
Lower-tropospheric OzoneSeasonality [Jiang and Yung, 1996; Kim et al., 2000a; Kim and Newchurch, 1996; Kim and Newchurch, 1998] derived lower-tropospheric ozone from Terrain-Height difference in TOMS columns.
Terrain-Height differences derived from clear-sky, Level-2, aerosol and sea-glint corrected TOMS columns.
Terrain-Height differences derived from clear-sky, Level-2, aerosol and sea-glint corrected TOMS columns.
Terrain-Height differences derived from clear-sky, Level-2, aerosol and sea-glint corrected TOMS columns.
Model/Measurement Comparisons Tropical tropospheric ozone derived by five different methods along with the mean, maximum, and minimum at each location in September 1997. CCP results from Clear-cloudy Pairs of observations CCD results from our calculation of the Convective Cloud Differential method TOR results from our calculation of the Tropospheric Ozone Residual (TOMS-SAGE) SAGE-CCP results from a hybrid of the CCP method where high clouds are present and SAGE stratospheric ozone where clouds are absent, Scan-angle results from differences of TOMS clear-sky total ozone columns taken at high scan angles and nadir scan angles
Monthly tropical tropospheric ozone calculated by MOZART-2 for 1991.
The difference between monthly CCP and MOZART tropospheric ozone in 1991.
Monthly tropical tropospheric ozone calculated by the Harvard GEOS-CHEM model in September 1996 – February 1997.
The difference between monthly CCP and GEOS-CHEM tropospheric ozone in September 1996 - February 1997
Recommendation • IOC/TPARC should investigate Tropospheric Ozone on Global to Regional scales to assess the processes responsible for temporal and spatial changes. • We should be much better prepared to interpret new satellite measurement of tropospheric species.
References • Bey, I., D.J. Jacob, R.M. Yantosca, J.A. Logan, B.D. Field, A.M. Fiore, Q. Li, H. Liu, and M.G. Schultz, Asian outflow to the Pacific Ocean in springtime: a 3D simulation of the PEM-West (B) mission with assimilated meteorology, J. Geophys. Res., Submitted, 2000. • DeCaria, A.J., K.E. Pickering, G.L. Stenchikov, J.R. Scala, J.L. Stith, J.E. Dye, B.A. Ridley, and P. Laroche, A cloud-scale model study of lightning-generated NOx in an individual thunderstorm during STERAO-A, J. Geophys. Res., 105, 11,601-11,616, 2000. • Fishman, J., and V.G. Brackett, The climatological distribution of tropospheric ozone derived from satellite measurements using version 7 Total Ozone Mapping Spectrometer and Stratospheric Aerosol and Gas Experiment data sets, J. Geophys. Res., 102, 19,275-19,278, 1997. • Fishman, J., C.E. Watson, J.C. Larsen, and J.A. Logan, Distribution of tropospheric ozone determined from satellite data, J. Geophys. Res., 95, 3599-3617, 1990. • Gregory, G.L., J.T. Merrill, M.C. Shipham, D.R. Blake, G.W. Sachse, and H.B. Singh, Chemical characteristics of tropospheric air over the Pacific Ocean as measured during PEM-West B: Relationship to Asian outflow and trajectory history, J. Geophys. Res., 102, 28,275-28,285, 1997. • Hauglustaine, D., L. Emmons, M. Newchurch, G. Brasseur, T. Takao, K. Matsubara, J. Johnson, B. Ridley, J. Stith, and J. Dye, On the Essential Role of NOx from Lightning in the Formation of Tropospheric Ozone Plumes in the Tropics, J. Atmos. Chem., in press,, 2000. • Hudson, R.D., and A.M. Thompson, Tropical tropospheric ozone from total ozone mapping spectrometer by a modified residual method, J. Geophys. Res., 103, 22,129-22,145, 1998. • Jaffe, D., A. Mahura, J. Kelley, J. Atkins, P.C. Novelli, and J. Merrill, Impact of Asian emissions on the remote North Pacific atmosphere: Interpretation of CO data from Shemya, Guam, Midway and Mauna Loa, J. Geophys. Res., 102, 28,627-28,635, 1997. • Jiang, Y., and Y.L. Yung, Concentrations of tropospheric ozone from 1979 to1992 over tropical Pacific South America from TOMS data, Science, 272, 714-716, 1996.
References • Kaji, Y., H. Akimoto, Y. Komazaki, S. Tanaka, H. Mukai, K. Murano, and J.T. Merrill, Long-range transport of ozone, carbon monoxide, and acidic trace gases at Oki Island, Japan, during PEM-WEST B/PEACAMPOT B campaign, J. Geophys. Res., 102, 28,637-28,649, 1997. • Kim, J., M.J. Newchurch, and K. Han, Distribution of Tropospheric Ozone Column Determined Directly from TOMS Measurements, TOMS Science Team meeting, Huntsville, AL, 2000a. • Kim, J.H., R.D. Hudson, and A.M. Thompson, A new method of deriving time-averaged tropospheric column ozone over the tropics using Total Ozone Mapping Spectrometer (TOMS) radiances: Intercomparison and analysis using TRACE A data, J. Geophys. Res., 101, 24,317-24,330, 1996. • Kim, J.H., and M.J. Newchurch, Climatology and trends of tropospheric ozone over the eastern Pacific Ocean: The influences of biomass burning and tropospheric dynamics, Geophys. Res. Lett., 23, 3723-3726, 1996. • Kim, J.H., and M.J. Newchurch, Biomass-burning influence on tropospheric ozone over New Guinea and South America, J. Geophys. Res., 103, 1455-1461, 1998. • Kim, J.H., M.J. Newchurch, and K. Han, Distribution of Tropical Tropospheric Ozone Determined Directly from TOMS Measurements, J. Atmos. Sci, In Press, 2000b. • Pickering, K.E., Y. Wang, W.-K. Tao, C. Price, and J.-F. Muller, Vertical distributions of lightning NOx for use in regional and global chemical transport models, J. Geophys. Res., 103, 31,203-31,216, 1998. • Thompson, A.M., and R.D. Hudson, Tropical tropospheric ozone (TTO) maps from Nimbus 7 and Earth Probe TOMS by the modified-residual method: Evaluation with sondes, ENSO signals, and trends from Atlantic regional time series, J. Geophys. Res., 104, 26,961-26,975, 1999. • Ziemke, J.R., S. Chandra, and P.K. Bhartia, Two new methods for deriving tropospheric column ozone from TOMS measurements: Assimilated UARS MLS/HALOE and convective-cloud differential techniques, J. Geophys. Res., 103, 22,115-22,127, 1998. • Ziemke, J.R., S. Chandra, A.M. Thompson, and D.P. McNamara, Zonal asymmetries in southern hemisphere column ozone: Implications of biomass burning, J. Geophys. Res., 101, 14,421-14,427, 1996.