Download
1 / 26
260 likes | 368 Views
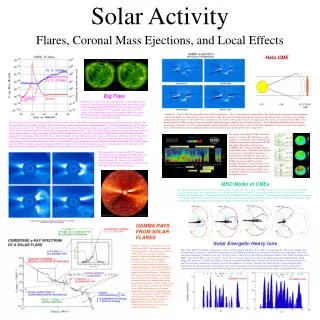
The “solar flare” of 14th, July, 2000. Observation from the detector “L3+Cosmics”. P. Ladron de Guevara on behalf of the L3+C collaboration . XXX REUNION BIENAL DE LA RSEF Ourense, 12-16 Septiembre, 2005. GROUND LEVEL ENHANCEMENTS (GLE s)

E N D
The “solar flare” of 14th, July, 2000. Observation from the detector “L3+Cosmics” P. Ladron de Guevara on behalf of the L3+C collaboration. XXX REUNION BIENAL DE LA RSEF Ourense, 12-16 Septiembre, 2005
GROUND LEVEL ENHANCEMENTS (GLE s) Solar protons are accelerated in high energy solar process such as: * Solar flares(SF s) * Coronal mass ejections(CME s) * First GLE observed : 1946 From then… ~ 60 GLEs detected (Worldwide network of neutron monitors, NMs) - Solar protons with energies > 100 MeV produce secondaries that can be observed at ground level (Ground Level Enhancements, GLE s) More than 100 NMs distributed at different geomagnetic latitudes Geomagnetic spectrometer (started by Simpson,1950)
From the Neutron Monitors (NMs) observations: (primaries energy threshold set by rigidity of the site) * The Sun can accelerate protons at least up to GeV energies * Huancayo NM (Peru) : solar protons > 13 GeV (29/Sept/1989) Modelling on data: (Ref. [1-3]) Description of the proton beam approaching the Earth : * Steep spectrum ( index ~ -6) * Anisotropic beams * Delayed components • - particle trajectory tracing. • model of magnetospheric magnetic field • data from several NMs for the same GLE (Ref 4) - Isolated NMs are not sensitive in detecting a directionally narrow beam, or excesses for E>5 GeV (statistics !!) - Add EAS arrays (E > 5 GeV) - Add underground muon telescopes if proton momentum high enough (??) Problems • Muon telescopes (directional) (Ref [5-8]) • Embudo => solar protons from 20-30 GeV (1989) • (35 mwe,New Mexico) • * Baksan => solar protons > 500 GeV (?) (1989) • (signal delayed 2 hrs after the impulsive flare phase ) L3+C is a muon telescope
Of interest : • -the limit in primary energy • the (an)isotropy of the proton beams • the spectral index • the existence of delayed components One GLE happened during L3+C operation, the14th July, 2000 (“Bastille Day” event) named as SF20000714 ( Ref [9-11] )
* Solar flare and CME associated. • * X5.7/3B from 9077 sunspot region (X class SF, x-ray wavelenght 5.7 Amstrongs) • * 10:24 UT X-ray flare peak • * 10:30 UT proton flux rapidly increased up to E> 100 MeV, observed by satellite GOES-8 • * During this period a full halo, earth directed CME was developped and observed • by SOHO/LASCO (Solar and Heliospheric Observatory/Large Angle Spectrometric Coronograph ) • A GLE event produced. The earliest increase occurred at 10:30 UT. • > 20 NMs observed flux increases in the range of 2 % => 60 % • * Reconstructed from ~20 NMs data, the solar protons have anisotropic incident direction, • energy threshold up to 6.7 GeV, soft spectrum with a power law index of –6 during • the rising phase, -7 at 11 h, -8 at 12 h. • *Particle arrival was anisotropic and changed with time. 10:00 UT (hrs) 6:40 13:20 16:40
L3+C schematic setup and momentum measurement. Mean energy loss : (molasse + magnet) 15 GeV
L3+C( Ref [12] ) angular resolution ~ 0.3 0 momentum resolution ~ 5 % (from 15 GeV-25 GeV) momentum threshold ~ 15 GeV/c sensitive volume 1000 m 3 magnetic field 0.5 T Coordinates : 6.02 0 E, 46.25 0 N , 450 m. asl 30 m. underground Magnetic rigidity cutoff ~ 5 GV • Event selection : • - Only a single muon track is present in the muon chamber. • Track composed of at least 3 segments of hits in P-chambers (wires parallel to magnetic field) • and 2 segments of hits in Z-chambers (wires perpendicular to magnetic field) • Back-tracking from muon chambers to the surface succesful,to ensure a good pointing. • Only muons with surface energies from 15 GeV to 25 GeV were consider at first step. Live-time binning: * 83.9 s (~1.4 min) live-time bin as the basic time unit in searching for possible signals. * The different time windows used in the search are multiples of the above.
The goal is the detection of an excess in flux in any direction. We divide the space according to the direction cosines: l= sin q . cos Fq : zenith, F : azimuth of the muon at surface. m= sin q . sin F The squared area of l and m was divided in a 10 x 10 grid. Ignoring the cells with poor acceptance, 41 sky cells remain for investigation.
to : flare time Square: Cell with coordinates: 19.60< Zenith<38.20 298.50<Azim.<331.50 ( cell 57 ) Contour lines: Equal acceptance Star marks: Sun direction every hour 57
The search of flux excess • Two kinds of methods used : • “Free” search. (“running means” method). • * Fix parameter : time start of the search ( 22:00 UT in 13th July) • * Free parameter: time window, tw (related to the unknown duration of the excess) • * Two alternative background determinations: • a) Computed from 12 h. before the S-F start time. (fixed background) • from 13/July 22:00 UT to 14/July 10:00 UT) • b) Computed as the mean of two backgrounds, 3h. of livetime before and after • the region of the “signal” • * Notice: • In a) the background is unique and assumed to be extrapolable to the S-F region. • In b) the background changes with the position and size of the time window and • - has the trend to dilute the “excess” if the time window is larger than the “signal” • - the statistical error is greater than for a) (by sqrt(2) ) • ...but reduces the influence of the local fluctuations.
The running means principle, method 1.b, variable background.
“Running means” principle: ( in a given directional cell ) ** pick a time window tw centered on the time t and compute :nsd = ( S(t,tw) – B(t,tw) ) / s( B(t,tw) )S(t,tw) is the number of entries in the interval with length tw and center at t. B(t,tw) is the background and s( B(t,tw) )stands for its mean standard deviation. ** run over tw (from 1.398 m. to 139.8 m.) and over t (the full day) to get nsd and find the absolute maximum of nsd and its corresponding t, tw( 3 values per directional cell )
Results: Only two cells (CR arrival directions) have been found with coincident t, tw from methods a) and b) in the interval from 10:00 to 11:00 Method 1a (fixed background) Method 1b) (variable background) Cell bakground excess max s time-window time (UT) background excess max s 57 259.7 59.3 3.74 18.18 min 10:34 260.8 58.2 2.65 59 2109.5 187.5 3.91 60.13 min 10:59 2094.9 202.1 3.14
2) “Guided” search. This search uses our knowledge of the 14th July 2000 GLE event. We search for protons with higher energies than established until now • The analysis of NMs data ( Ref [5] )shows a soft solar proton spectrum (g= - 6) and became softer • with time => the higher the solar proton energy, the shorter the signal duration time • We search for short signals. • We concentrate on a short period starting from 10:20 UT (the onset time of the type II radio burst) and around the peak time of the increase seen by the NMs. (~ 10:UT=> ~12:00 UT) • Background: • From GOES-8(Ref [9]) => Event rate of protons with energies > 100 MeV stable during the 12 hours • before 10:00. The background is extracted from this range, the same as for method 3a) above. • Search of excess : • 1- Check of possible excesses during the peak time of NMs only. • 2- Search for an excess using a bin (tw) unit (83.9 s live-time) starting from 10:20 UT • 3- When found, (at 10:24 UT in cell 57 only), add the next bins up to the point that the excess start to • decrease. • 4- 11 live-time units were so gathered amounting to a tw = 16.78 min. • 5- The fit of the background with the 16.78 min bin compared to the the excess allowed to measure a • 4.2 s effect • 6- It was also checked whether there were other possible excesses appearing at delayed times. • 5 16.78 min. live-time bins were examined from 9:52 UT to 11:51 UT over the 41 cells and no • other excess than the one reported was found.
Cell 57 Bkg=235 Excess=65 s=4.2 tw=16.7min. time=10:33 UT
Resumee The “free” and “guided” searches are coincident in finding an excess at very close time and time-window in cell 57 , with directions: 19.60< Zenith<38.20 298.50<Azim.<331.50 Free search : time: 10:34 UT with time-window = 18.18 min (3.74 s) Guided search : time: 10:33 UT with time-window = 16.78 min (4.22 s) From Monte-Carlo simulation, the probability for the excess of 4.2 s in one of the 41 sky cells being due to a background fluctuation is ~ 1 % (small significance !!) No excess was found for muons at > 25 GeV in the cell 57.
Assuming the muon excess being produced by protons associated to the GLE: What is the primary energy of such protons ? MC simulation (Air simulation code CORSIKA) *Primary proton spectrum with exponent of –6 above 20 GeV *Primary protons assumed to be incident along the directions that make the produced muons to appear in cell 57. (85 % of the produced muons come from the region 40-100 GeV with most probable energy of 70 GeV)
Upper limit of the solar flare induced proton flux *The MC produced muons on the surface are recorded *Large enough area centered around the m-chambers was set to ensure less of 1 % loss of muons. *Muons were traced through the molasse and m-chambers and its tracks reconstructed. Background: Same procedure as for the “signal”, but using the primary ray spectrum power law index–2.7 Comparison between observed data and simulated data gives un upper limit of the flux: I(Ep > 40 GeV ) < 2.8 x 10 –3 cm –2 sec –1 sr –1 (90% c. l.)
Comparison with other measurements and theoretical upper limits
Conclusions • * In the GLE event of the 14th July 2000 a 4.2 s excess of muons with Em = 15-25 GeV • in a particular sky region was observed which lasted from 10:24 UT to 10:42 UT. • The probability of finding such an excess in this search as a fluctuation of the • background is ~ 1% • It was time-coincident with the peak increase observed by 20 different NMs during • the impulsive phase of the solar flare, at 10:30 UT • * If the excess was really induced by solar protons the observation might indicate that • solar protons with energies higher than 40 GeV were generated in this event. • The upper limit of a solar proton beam entering the upper atmosphere around the • space direction • 19.60< Zenith<38.20 • 298.50<Azim.<331.50 • and corresponding to the excess was determined to be : • I(Ep > 40 GeV ) < 2.8 x 10 –3 cm –2 sec –1 sr –1 (90% c. l.)
References 1- M.L. Duldig, Proceedings of 27th ICRC, 3363 (2001) 2- V.V. Pchelkin et al., Proceedings of the 27th ICRC ,3379, ( 2001 ). 3- E.V. Vashenyuk et al., Proceedings of 27th ICRC, 3383, ( 2001 ). 4- N.A. Tsyganenko, Planet Space Sci. 37,5, ( 1989 ). 5- A.T. Filippov et al., 22nd ICRC, Dublin,3,113,( 1991 ). 6- E.N. Alexeyev et al., Geomagn. Aeron.,32,192, ( 1992 ). 7- E.N. Alexeyev et al., Geomagn. Aeron.,34,143, ( 1994 ). 8- S.N. Karpov et al., Nuo. Cim.,21C,551, ( 1998 ). 9- http://crlhir.crl.go.jp/dimages/gpa1day/proton/20000714.gif 10- http://crlhir.crl.go.jp/tserdin/plain_report/20000714_forecast.ht1m 11- A.V. Belov et al.,Proceedings of 27th ICRC, 3446,( 2001 ). 12- O. Adriani et al., Nucl. Instr. And Methods in Physics Research, A488,209,(2002).