Download
1 / 14
140 likes | 337 Views
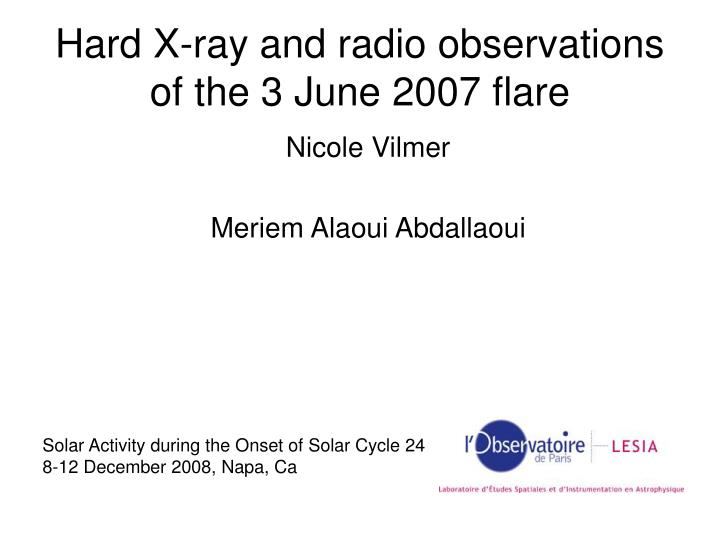
Hard X-ray and radio observations of the 3 June 2007 flare. Nicole Vilmer Meriem Alaoui Abdallaoui. Solar Activity during the Onset of Solar Cycle 24 8-12 December 2008, Napa, Ca. GOES 0.5-4 A. The Context. RHESSI. GOES C3.5 flare SF Flare S07 E65 LASCO CME Narrow (70°) and slow

E N D
Hard X-ray and radio observations of the 3 June 2007 flare Nicole Vilmer Meriem Alaoui Abdallaoui Solar Activity during the Onset of Solar Cycle 24 8-12 December 2008, Napa, Ca
GOES 0.5-4 A The Context RHESSI GOES C3.5 flare SF Flare S07 E65 LASCO CME Narrow (70°) and slow (393 km/s)) Radio flux= flux from the AR 6-10 keV and 13-25 keV Fluxes are derived from Spectral analysis (see after) NRH RHESSI RHESSI RHESSI NRH
The Context WIND WAVES 0.02 MHz-14 MHZ DAM Nançay 10-70 MHz PHOENIX Zürich 116-1000 MHz RHESSI count spectrum Type III bursts first below 100 MHz And then at higher frequencies With HXR emissions Type II burst below 80 MHz Faint continuum around 300 MHz 09:24 09:40 Attenuator changes
Spatial Evolution of the X-ray flare as seen from Hinode and RHESSI XRT Al_Thick >107 K XRT Ti-poly around 107K Source at the north from 093350
XRT RHESSI 3-6 keV, 6-12 keV and 12-25 keV
RHESSI image 50-100 keV 09:27:07 UT with pixon Spectral index-3
09:26:23 09:26:37 150 MHz: red 236 MHz: yellow 241 MHz green 327 MHz blue 408 MHz light blue 432 MHz purple 09:26:57
432 MHz 432 MHz 408 MHz 09:27:45 09:27:58 327 MHz 241 MHz 09:28:06 09:28:00 236 MHz 150 MHz 150 MHz 09:29:06 09:28:25
432 MHz 432 MHz 408 MHz 09:31:16 09:30:06 327 MHz 241 MHz 09:28:06 09:32:16 09:28:00 236 MHz 09:32:31 150 MHz 150 MHz 09:29:06 09:28:25
432 MHz 236 MHz 150 MHz
432 MHz 432 MHz 408 MHz 09:31:16 09:30:06 327 MHz 241 MHz 09:28:06 09:32:16 09:28:00 236 MHz 09:32:31 150 MHz 150 MHz Cospatiality of the X-ray and radio sources Radio spectrum Origin of the emission?? 09:29:06 09:28:25
Preliminary conclusions and working directions Unusual observational facts: from 09:34 UT (end of the X-ray flare) new X-ray source observed by RHESSI in the 10 keV range (thermal??) cospatial with bright source observed with XRT, north of the main flaring region One leg of the CME structure? New energy release due to reconnection in III From Owens and Crooker, 2006
Preliminary conclusions and working directions • Unusual observational facts: from 09:34 UT (end of the X-ray flare) Weak (a few sfu) radio emission from 450MHz to 150 MHZ Emission at all frequencies cospatial with X-ray emission (centroid not same size…) Flat radio spectrum Origin?? Thermal bremsstrahlung or gyro synchrotron?? The radio emission must escape from the medium lower density region than usual (local mass loss due to the CME??)