Download
1 / 1
10 likes | 139 Views
Image from: Wisconsin Department of Agriculture, Trade & Consumer Protection . Possible Nonvisual I ndicators of the Emerald Ash Borer Gabriel Horton – gdr7@unh.edu B.S. Forestry, Department of Natural Resources and the Environment. University of New Hampshire. Abstract. Results ( cont ).

E N D
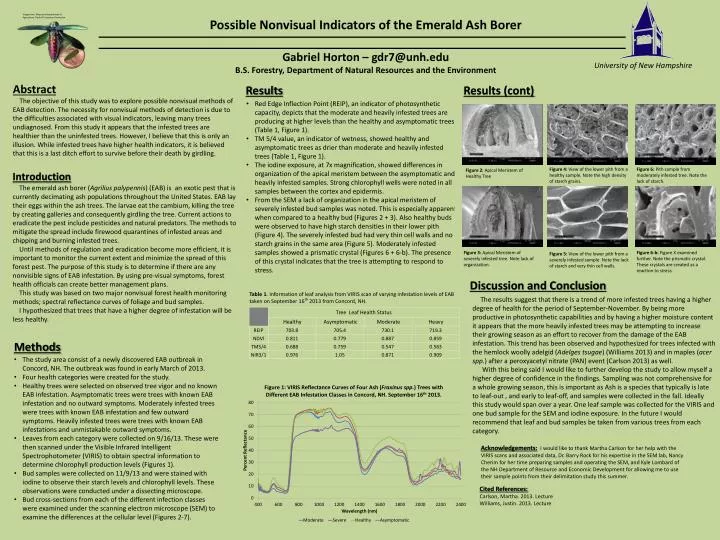
Image from: Wisconsin Department of Agriculture, Trade & Consumer Protection Possible Nonvisual Indicators of the Emerald Ash Borer Gabriel Horton – gdr7@unh.edu B.S. Forestry, Department of Natural Resources and the Environment University of New Hampshire Abstract Results (cont) Methods The objective of this study was to explore possible nonvisual methods of EAB detection. The necessity for nonvisual methods of detection is due to the difficulties associated with visual indicators, leaving many trees undiagnosed. From this study it appears that the infested trees are healthier than the uninfestedtrees. However, I believe that this is only an illusion. While infested trees have higher health indicators, it is believed that this is a last ditch effort to survive before their death by girdling. • The study area consist of a newly discovered EAB outbreak in Concord, NH. The outbreak was found in early March of 2013. • Four health categories were created for the study. • Healthy trees were selected on observed tree vigor and no known EAB infestation. Asymptomatic trees were trees with known EAB infestation and no outward symptoms. Moderately infested trees were trees with known EAB infestation and few outward symptoms. Heavily infested trees were trees with known EAB infestations and unmistakable outward symptoms. • Leaves from each category were collected on 9/16/13. These were then scanned under the Visible Infrared Intelligent Spectrophotometer (VIRIS) to obtain spectral information to determine chlorophyll production levels (Figures 1). • Bud samples were collected on 11/9/13 and were stained with iodine to observe theirstarch levels and chlorophyll levels. These observations were conducted under a dissecting microscope. • Bud cross-sections from each of the different infection classes were examined under the scanning electron microscope (SEM) to examine the differences at the cellular level (Figures 2-7). Introduction Figure 4: View of the lower pith from a healthy sample. Note the high density of starch grains. Figure 6: Pith sample from moderately infested tree. Note the lack of starch. Figure 2: Apical Meristem of Healthy Tree The emerald ash borer (Agriliuspalypennis) (EAB) is an exotic pest that is currently decimating ash populations throughout the United States. EAB lay their eggs within the ash trees. The larvae eat the cambium, killing the tree by creating galleries and consequently girdling the tree. Current actions to eradicate the pest include pesticides and natural predators. The methods to mitigate the spread include firewood quarantines of infested areas and chipping and burning infested trees. Until methods of regulation and eradication become more efficient, it is important to monitor the current extent and minimize the spread of this forest pest. The purpose of this study is to determine if there are any nonvisible signs of EAB infestation. By using pre-visual symptoms, forest health officials can create better management plans. This study was based ontwo major nonvisual forest health monitoring methods; spectral reflectance curves of foliage and bud samples. I hypothesized that trees that have a higher degree of infestation will be less healthy. Figure 3: Apical Meristem of severely infested tree. Note lack of organization. Figure 6-b: Figure X examined further. Note the prismatic crystal. These crystals are created as a reaction to stress. Figure 5: View of the lower pith from a severely infested sample. Note the lack of starch and very thin cell walls. Discussion and Conclusion Table 1. Information of leaf analysis from VIRIS scan of varying infestation levels of EAB taken on September 16th 2013 from Concord, NH. The results suggest that there is a trend of more infested trees having a higher degree of health for the period of September-November. By being more productive in photosynthetic capabilities and by having a higher moisture content it appears that the more heavily infested trees may be attempting to increase their growing season as an effort to recover from the damage of the EAB infestation. This trend has been observed and hypothesized for trees infected with the hemlock woolly adelgid (Adelgestsugae) (Williams 2013) and in maples (acer spp.) after a peroxyacetylnitrate (PAN) event (Carlson 2013) as well. With this being said I would like to further develop the study to allow myself a higher degree of confidence in the findings. Sampling was not comprehensive for a whole growing season, this is important as Ash is a species that typically is late to leaf-out , and early to leaf-off, and samples were collected in the fall. Ideally this study would span over a year. One leaf sample was collected for the VIRIS and one bud sample for the SEM and iodine exposure. In the future I would recommend that leaf and bud samples be taken from various trees from each category. Results • Red Edge Inflection Point (REIP), an indicator of photosynthetic capacity, depicts that the moderate and heavily infested trees are producing at higher levels than the healthy and asymptomatic trees (Table 1, Figure 1). • TM 5/4 value, an indicator of wetness, showed healthy and asymptomatic trees as drier than moderate and heavily infested trees (Table 1, Figure 1). • The iodine exposure, at 7x magnification, showed differences in organization of the apical meristem between the asymptomatic and heavily infested samples. Strong chlorophyll wells were noted in all samples between the cortex and epidermis. • From the SEM a lack of organization in the apical meristem of severely infested bud samples was noted. This is especially apparent when compared to a healthy bud (Figures 2 + 3). Also healthy buds were observed to have high starch densities in their lower pith (Figure 4). The severely infested bud had very thin cell walls and no starch grains in the same area (Figure 5). Moderately infested samples showed a prismatic crystal (Figures 6 + 6-b). The presence of this crystal indicates that the tree is attempting to respond to stress. Acknowledgements:I would like to thank Martha Carlson for her help with the VIRIS scans and associated data, Dr. Barry Rock for his expertise in the SEM lab, Nancy Cherim for her time preparing samples and operating the SEM, and Kyle Lombard of the NH Department of Resource and Economic Development for allowing me to use their sample points from their delimitation study this summer. Cited References: Carlson, Martha. 2013. Lecture Williams, Justin. 2013. Lecture