Download
1 / 111
1.24k likes | 1.61k Views
POPULATIONS AND SAMPLING. Let’s Look at our Example Research Question. Population. Who Do You Want These Study Results to Generalize To??.

E N D
Let’s Look at our Example Research Question Population Who Do You Want These Study Results to Generalize To?? How do UF COP pharmacy students who only watch videostreamed lectures differ from those who attend class lectures (and also have access to videostreamed lectures) in terms of learning outcomes?
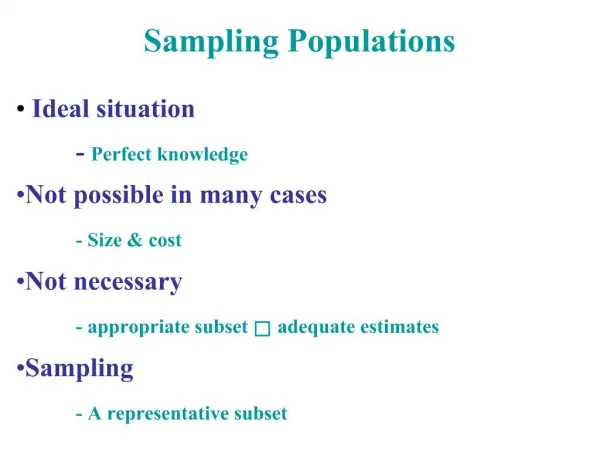
Population • The group you wish to generalize to is yourpopulation. • There are two types: • Theoretical population In our example, this would be all pharmacy students in the US • Accessible population In our example, this would be all COP pharmacy students
Sampling • Target population or the Sampling frame: All in the accessible population that you can draw your sample from. • Sample: The group of people you select to be in the study. A subgroup of the target population This is not necessarily the group that is actually in your study.
Sampling How you select your sample:
Sample Size Select as large a sample as possible from your population. • There is less potential error that the sample is different from the population when you use a large sample. • Sampling error: The difference between the sample estimate and the true population value (example: exam score).
Sample Size • Sample size formulas/tables can be used. Factors that are considered include: Confidence in the statistical test Sampling error • See Appendix B in Creswell (pg 630) Sampling error formula – used to determine sample size for a survey Power analysis formula – used to determine group size in an experimental study.
Back to Our Example • How do UF COP pharmacy students who only watch videostreamed lectures differ from those who attend class lectures (and also have access to videostreamed lectures) in terms of learning outcomes? • What is our theoretical population? • What is our accessible population? • What sampling strategy should we use?
Important Concept Random sampling vs random assignment • We have talked about random sampling in this session. • Random sampling is not the same as random assignment. Random sampling is used to select individuals from the population who will be in the sample. Random assignment is used in an experimental design to assign individuals to groups.
VALIDITY Lou Ann Cooper, PhD Director of Program Evaluation and Medical Education Research University of Florida College of Medicine
INTRODUCTION • Both research and evaluation include: • Design – how the study is conducted • Instruments – how data is collected • Analysis of the data to make inferences about the effect of a treatment or intervention. • Each of these components can be affected by bias.
INTRODUCTION • Two types of error in research • Random error due to random variation in participants’ responses at measurement. Inferential statistics, i.e. the p-value and 95% confidence interval, measure random error and allow us to draw conclusions based on research data. • Systematic error or bias.
BIAS: DEFINITION • Deviations of results (or inferences) from the truth, or processes leading to such deviation. Any trend in the selection of subjects, data collection, analysis, interpretation, publication or review of data that can lead to conclusions that are systematically different from the truth. • Systematic deviation from the truth that distorts the results of research.
BIAS • Bias is a form of systematic error that can affect scientific investigations and distort the measurement process. • Bias is primarily a function of study design and execution, not of results, and should be addressed early in the study planning stages. • Not all bias can be controlled or eliminated; attempting to do so may limit usefulness and generalizability. • Awareness of the presence of bias will allow more meaningful scrutiny of the results and conclusions. • A biased study loses validity and is a common reason for invalid research.
POTENTIAL BIASES IN RESEARCH AND EVALUATION • Study Design • Issues related to Internal validity • Issues related to External validity • Instrument Design • Issues related to Construct validity • Data Analysis • Issues related to Statistical Conclusion validity
VALIDITY Validity is discussed and applied based on two complimentary conceptualizations in education and psychology: • Test validity: the degree to which a test measures what it was designed to measure. • Experimental validity: the degree to which a study supports the intended conclusion drawn from the results.
FOUR TYPES OF VALIDITY QUESTIONS Can we generalize to other persons, places, times? External Can we generalize to the constructs? Construct Internal Is the relationship causal? Conclusion Is there a relationshipbetween cause and effect?
CONCLUSION VALIDITY • Conclusion validity is the degree to which conclusions we reach about relationships are reasonable, credible or believable. • Relevant for both quantitative and qualitative research studies. • Is there a relationship in your data or not?
STATISTICAL CONCLUSION VALIDITY • Basing conclusions on proper use of statistics • Reliability of measures • Reliability of implementation • Type I Errors and Statistical Significance • Type II Errors and Statistical Power • Fallacies of Aggregation
STATISTICAL CONCLUSION VALIDITY • Interaction and non-linearity • Random irrelevancies in the experimental setting • Random heterogeneity of respondents
VIOLATED ASSUMPTIONS OF STATISTICAL TESTS • The particular assumptions of a statistical test must be met if the results of the analysis are to be meaningfully interpreted. • Levels of measurement. • Example: Analysis of Variance (ANOVA)
LEVELS OF MEASUREMENT • A hierarchy is implied in the ides of level of measurement. • At lower levels, assumptions tend to be less restrictive and data analyses tend to be less sensitive. • In general, it is desirable to have a higher level of measurement (interval or ratio) rather than a lower one (nominal or ordinal).
STATISTICAL ANALYSIS AND LEVEL OF MEASUREMENT ANALYSIS OF VARIANCE ASSUMPTIONS • Independence of cases. • Normality. In each of the groups, the data are continuous and normally distributed. • Equal variances or homoscedasticity. The variance of data in groups should be the same. • The Kruskal-Wallis test is a nonparametric alternative which does not rely on an assumption of normality.
RELIABILITY • Measures (tests and scales) of low reliability may not register true changes. • Reliability of treatment implementation – when treatments/procedures are not administered in a standard fashion, error variance is increased and the chance of obtaining true differences will decrease.
STATISTICAL DECISION TRUE POPULATION STATUS
TYPE I ERRORS AND STATISTICAL SIGNIFICANCE • A Type I error is made when a researcher concludes that there is a relationship and there really isn’t (False positive) • If the researcher rejects H0 because p ≤ .05, ask: • If data are from a random sample, is significance level appropriate? • Are significance tests applied to a priori hypotheses? • Fishing and the error rate problem
TYPE II ERRORS AND STATISTICAL POWER • A Type II error is made when a researcher concludes that there is not a relationship and there really is (False negative) • If the researcher fails to reject H0 because p > .05, ask: • Has the researcher used statistical procedures of adequate power? • Does failure to reject H0 merely reflect a small sample size?
FACTORS THAT INFLUENCE POWER AND STATISTICAL INFERENCE • Alpha level • Effect size • Directional vs. Non-directional test • Sample size • Unreliable measures • Violating the assumptions of a statistical test
RANDOM IRRELEVANCIES • Features of the experimental setting other than the treatment affect scores on the dependent variable • Controlled by choosing settings free from extraneous sources of variation • Measure anticipated sources of variance to include in the statistical analysis
RANDOM HETEROGENEITY OF RESPONDENTS • Participants can differ on factors that are correlated with the major dependent variables • Certain respondents will be more affected by the treatment than others • Minimized by • Blocking variables and covariates • Within subjects designs
STRATEGIES TO REDUCE ERROR TERMS • Subjects as own control • Homogeneous samples • Pretest measures on the same scales used for measuring the effect • Matching on variables correlated with the post-test • Effects of other variables correlated with the post-test used as covariates • Increase the reliability of the dependent variable measures
STRATEGIES TO REDUCE ERROR TERMS • Estimates of the desired magnitude of a treatment effect should be elicited before research begins • Absolute magnitude of the treatment effect should be presented so readers can infer whether a statistically reliable effect is practically significant.
INTERNAL VALIDITY • Internal validity has to do with defending against sources of bias arising in a research design. • To what degree is the study designed such that we can infer that the educational intervention caused the measured effect. • An internally valid study will minimize the influence of extraneous variables. Example: Did participation in a series of Webinars on TB in children change the practice of physicans?
HISTORY MATURATION INTERACTIONS WITH SELECTION MORTALITY TESTING THREATS TO INTERNAL VALIDITY SELECTION INSTRUMENTATION STATISTICAL REGRESSION
INTERNAL VALIDITY: THREATS IN SINGLE GROUP REPEATED MEASURES DESIGNS • History • Maturation • Testing • Instrumentation • Mortality • Regression
THREATS TO INTERNAL VALIDITY HISTORY • The observed effects may be due to or be confounded with nontreatment events occurring between the pretest and the post-test • History is a threat to conclusions drawn from longitudinal studies • Greater time period between measurements = more risk of a history effect • History is not a threat in cross sectional designs conducted at one point in time
THREATS TO INTERNAL VALIDITY MATURATION • Invalid inferences may be made when the maturation of participants between measurements has an effect and this maturation is not the research interest. • Internal (physical or psychological) changes in participants unrelated to the independent variable – older, wiser, stronger, more experienced.
THREATS TO INTERNAL VALIDITY TESTING • Reactivity as a result of testing • The effects of taking a test on the outcomes of a second test • Practice • Learning • Improved scores on the second administration of a test can be expected even in the absence of intervention due to familiarity
THREATS TO INTERNAL VALIDITY INSTRUMENTATION • Changes in instruments, observers or scorers which may produce changes in outcomes • Observers/raters, through experience, become more adept at their task • Ceiling and floor effects • Longitudinal studies
THREATS TO INTERNAL VALIDITY STATISTICAL REGRESSION • Test-retest scores tend to drift systematically to the mean rather than remain stable or become more extreme • Regression effects may obscure treatment effects or developmental changes • Most problematic when participants are selected because they are extreme on the classification variable of interest
THREATS TO INTERNAL VALIDITY MORTALITY • Differences in drop-out rates/attrition across conditions of the experiment • Makes “before” and “after” samples not comparable • This selection artifact may become operative in spite of random assignment • Major threat in longitudinal studies
INTERNAL VALIDITY: MULTIPLE GROUP THREATS • Selection • Interactions with Selection • Selection-History • Selection-Maturation • Selection-Testing • Selection-Instrumentation • Selection-Mortality • Selection-Regression
THREATS IN DESIGNS WITH GROUPS: SOCIAL INTERACTION THREATS • Compensatory equalization of treatments • Compensatory rivalry • Resentful demoralization • Treatment imitation or diffusion • Unintended treatments
EXTERNAL VALIDITY • The extent to which the results of a study can be generalized • Population validity – generalizations related to other groups of people • Ecological validity – generalizations related to other settings, times, contexts, etc.
THREATS TO EXTERNAL VALIDITY • Pre-test treatment interaction • Multiple treatment interference • Interaction of selection and treatment • Interaction of setting and treatment • Interaction of history and treatment • Experimenter effects
THREATS TO EXTERNAL VALIDITY • Reactive arrangements • Artificial environment • Hawthorne effect • Halo effect • John Henry effect • Placebo effect • Participant-researcher interaction • Novelty effect
SELECTING A RESEARCH DESIGN Lou Ann Cooper, PhD Director of Program Evaluation and Medical Education Research University of Florida College of Medicine
What If…. We gave 150 pharmacy students (all are distance campus) access to streaming video and then measured their performance on a written exam (measures achievement of learning outcomes)…..
PRE-EXPERIMENTAL DESIGNS One Group Posttest Design X O X = Implementation of the treatment O = Measurement of the participants in the experimental group Also referred to as ‘One Shot Case Study’
What If…. For Discussion: What are the treats to validity? We gave 150 pharmacy students (all are distance campus) access to streaming video and then measured their performance on a written exam (measures achievement of learning outcomes)…..