Download
1 / 12
120 likes | 260 Views
Unintended Consequences due to Salinity Management – Example from the Lower Colorado River. Multi-State Salinity Coalition 2012 Annual Conference January 25, 2012 Chuck Cullom Colorado River Programs Manager. Colorado River Basin. Complex River System 10 major reservoirs

E N D
Unintended Consequences due to Salinity Management – Example from the Lower Colorado River Multi-State Salinity Coalition 2012 Annual Conference January 25, 2012 Chuck Cullom Colorado River Programs Manager
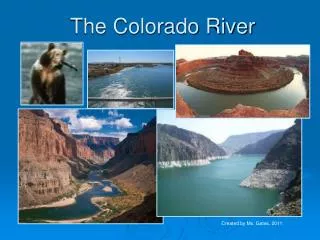
Colorado River Basin • Complex River System • 10 major reservoirs • 14.7 maf Av. Supply • 34 million people • 4 million irrigated acres • Salt load long-term • concern to users • Study Structure and Schedule • Summary of Key Activities • Upcoming Meetings • Further Discussion, Follow-up
Distribution of Flow and Salt Load • Salinity increases • downstream • Natural sources • Springs • Tributaries • Evaporation • Ag runoff • M&I discharges
Lower Colorado River Key Facilities • Imperial Dam • Point of diversion for 5 maf/yr • Morelos Dam • Point of delivery for Mexico - 1.5maf/af • Yuma Desalting Plant • Cienega de Santa Clara • Significant wetland in Mexico relying on US drainage water • Study Structure and Schedule • Summary of Key Activities • Upcoming Meetings • Further Discussion, Follow-up
Lower Colorado River Salinity Requirements • Numeric Criteria • Hoover – 723 ppm • Parker – 747 ppm • Imperial – 879 ppm • International Water Treaty • Delivery point = Morelos Dam • Salinity Differential • Imperial Dam + 115 ppm +/- 30 ppm • Study Structure and Schedule • Summary of Key Activities • Upcoming Meetings • Further Discussion, Follow-up
Sources of Water for Delivery to Mexico Colorado River Water Natural drainage Ag drainage Pumped Drains MAXIMIZE Efficient Water Management + MEET Treaty Requirements
Yuma Area Return Flows • ~80% CR Water • ~20% Drainage • Linkage between • Surface flows • Drainage • Pumping
What do we already know? • YDP operated at 30% capacity from May 3, 2010 to March 26, 2011 • YDP operations diverted flow away from Bypass Drain/Ciénega • YDP operations added brine to Bypass Drain • 30,000 acre-feet of “arranged water” added to Bypass Drain/Ciénega • in 18 month period from Oct 29, 2009 until April 28, 2011 • Magnitude 7.0 earthquake, April 4, 2010 • Extensive fire, March 23-25, 2011 There are no simple experiments in nature