Download
1 / 19
200 likes | 352 Views
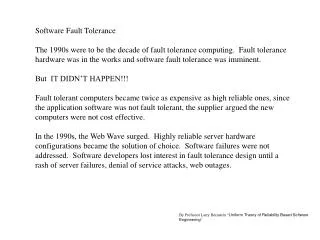
Automation of Software Fault Prediction. Thomas Ostrand Elaine Weyuker AT&T Labs – Research Florham Park, NJ. What is a Fault?. A fault is a change to an executable file made in response to observed incorrect or undesirable behavior of the software.

E N D
Automation of Software Fault Prediction Thomas Ostrand Elaine Weyuker AT&T Labs – Research Florham Park, NJ
What is a Fault? • A fault is a change to an executable file made in response to observed incorrect or undesirable behavior of the software. • A single observation can lead to multiple faults, if multiple files have to be changed.
What is Fault Prediction? • Identifying the X% of files most likely to have faults in a future release of the software. • Identifying the files most likely to have X% of the faults in a future release.
Is Fault Prediction Feasible and Useful? • In large systems we have studied, faults tend to be concentrated in very small percentages of the system. • The models we have constructed have identified 20% of all files that contain 80-90% of all faults in a given release.
Percent of Faults Contained in Top 20% of Files Selected by Model(Average = 83%) Release
Request for X% of Faults 120 100 80 % Requested 60 % Actual % Files 40 20 0 60 70 80 90 95
Goal / Non-Goal • List the files that are most likely to have faults, in order of decreasing number. • Provide a list of files that are likely to have a given percentage of all faults. • Pinpoint specific locations where faults will be. • Predict number of faults.
Model 1 • Needs only LOC of all files • Very simple to produce fault-proneness ranking • Results are not as accurate as other models, but still surprisingly good Rank(f) = KLOC
Model 2 • Needs LOC, New/Old, Changed/NotChanged • Still very simple to acquire data • Coefficients are fixed • Results approach Model 3 in accuracy Rank(f) = 0.7*log(KLOC) + 2.0*(New) + 1.0*(Changed)
Model 3 • Age, Language, and count of Changes straightforward • Need count of prior Faults; may be difficult • Coefficients for each release are adjusted based on prior releases • Accuracy is very high Rank(f) = 0.52*log(KLOC) + 1.86*(New) + 0.91*(Age==1) + 0.35*(Age==2,3,4) + 0.44*sqrt(Changes[-1]) + 0.32*sqrt(Changes[-2]) + 0.38*sqrt(Faults[-1]) + func(Language)
Model 4 (“research model”) • Data collection same as Model 3 • Structure of equation adjusted to produce best possible results • Coefficients based on prior releases • Not suitable for operational fault prediction
Data Needed for Predictions • LOC • New file (0/1) • Changed file (0/1) • Age (1,2,3,4) • Prior changes • Prior faults • Language Model 1 Model 2 Model 3
Automated Prediction System Phase 1: Data acquisition Phase 2: Construct prediction model Phase 3: Apply model to current data
Current Status (Phase 1) • Data acquisition driven by shell scripts, from Unix command line • User provides small configuration file: • releases to be analyzed • location of code • filetypes to be considered • information to characterize faults
Current Status (Phases 2 & 3) Models 1 & 2 are immediately usable. Interface for applying prediction not yet built.
Issues of Modeling • Different fault databases • Different version control systems • Locating all the data (active/inactive DB) • Proper interpretation of data – what is a fault? • Data credibility – do users enter accurate information?
Issues of Presentation • Users need simplicity – minimal information entry, no tough decisions • Results presented clearly and simply • Mathematics should be transparent, but available if user wants to see it
Future Automation • Universal intermediate data format • Individual transformers from each separate fault DB/version control system • Model constructor to fit predictor equations to collected data • Visual or form-based user interface • Graph presentation of results
Cumulative faultswith files in different orders 300 250 200 150 Cumulative Number of Faults Actual Fault Order 100 Predicted Fault Order Random Order 50 0 1 92 183 274 365 456 547 638 729 820 911 1002 1093 1184 1275 1366 1457 1548 1639 1730 Number of Files