Download
1 / 30
310 likes | 572 Views
Dimensioning Tray Columns. Prof. Dr. Marco Mazzotti - Institut für Verfahrenstechnik. GEOMETRICAL VALUES h w ,weir height h cl , Skirt clearence height of the downcomer h L , Clear liquid height h p , pressure drop between downcomer inlet and outlet. h f , froth height H, tray spacing

E N D
Dimensioning Tray Columns Prof. Dr. Marco Mazzotti - Institut für Verfahrenstechnik
GEOMETRICAL VALUES hw,weir height hcl, Skirt clearence height of the downcomer hL, Clear liquid height hp, pressure drop between downcomer inlet and outlet. hf, froth height H, tray spacing lcl,, skirt clearance lw,weir length d, diameter SURFACES Aac, active area Ah, hole area a, interfacial area f, relative free area PHYSICAL PROPERTIES ML, molar mass of the liquid phase MG, molar mass of the gas phase DL, diffusion coefficient of the liquid DG, diffusion coefficient of the gas rL, density of the liquid phase rG, density of the gas phase s, surface tension hG, viscosity of the gas phase m, slope of the equilibrium line (linear case)
VELOCITIES/ FLOWS V, gas/liquid flow uLd, velocity of clear liquid in the downcomer uG, superficial velocity F, gas load vo, velocity of gas in the holes Fh, gas load in the holes uG, superficial velocity of the gas (VG/Aac) ed, volume fraction of the dispersed phase eL, relative liquid holdup COEFFICIENTS CG, capacity factor Co, discharge factor xsp, friction coefficient a, discharge coefficient b, mass transfer coefficients zsp,friction factor of the drop eLd, relative liquid content PRESURE DROP Dpd, pressure drop on a dry tray DpL, pressure drop in the clear liquid height (hL) DpR, pressure drop by several phenomena
OTHER yn-1, composition of the gas entering the tray y*(x), composition of the gas at equilibrium with a liquid of composition x yn, composition of the gas going out from the tray y*(xn), composition of the gas at equilibrium with a liquid of composition xn xn, composition of the liquid in the outlet downcomer EOG, point efficiency EOGM, tray efficiency or Murphree NOG, gas side overall transfer units NG, gas side transfer units NL, liquid side transfer units
PART I: Operating region of tray columns • Maximum gas load • Minimum gas load • Maximum liquid load • Minimum liquid load • Operating region of tray columns
(I-1) (I-2) (I-3) Maximum Gas Load The gas load in a tray column can be increased up to a point where the gas blows the liquid off the tray in form of fine droplets. The liquid then no longer flows countercurrently to the gas, and proper column operation ends. Souders and Brown were the first to develop in 1934 a systematic approach for calculating the maximum gas load of a tray. They considered a single drop suspended above the tray and formulated the equilibrium of friction force and weight force minus buoyancy: The gas load is usually expressed by the F-factor that represents the square root of the kinetic energy of the gas flow. It is defined by : Combining the two expressions we arrive to another expression of F. Finally it can be expressed in terms of the capacity factor, CG. See correlations for the gas capacity factor, Souders and Brown, Kirschbaum, Wenzel, etc...
(I-4) (I-5) ( I-6) (I-7) cont. Maximum Gas Load The maximum gas load is expressed as a function of the Weber-number (We=r u2d/s). There is a critical value of the Weber number that gives us the critical gas load: Using equation I-2 in the Weber-number definition and then, isolating d, we get: Where Fh is the gas load in the holes of the tray. To write the expression in terms of the gas load, F, we use the definition of relative free area (f): Combining the last two equations with equation I-3: According to Wallis the value of the critical Weber number is approximately 12 for liquids with low viscosity. If the friction coefficient (xsp) is assumed to be 0.4 (the value for rigid spheres in turbulent flow), the equation I-6 becomes:
(I-8) ( I-9) Minimum Gas Load The gas load of the column tray can be decreased to a point where either the gas no longer flows uniformly though all the tray openings or the liquid leaks though the tray. Both modes of operation should be avoided because they diminish tray efficiency. According to Mersmann, gas flows uniformly through all the holes of a sieve tray when the Weber-number in the hole (hole diameter and hole velocity) , exceeds a critical value of 2. From this condition follows: According to Ruff, the liquid is prevented from leaking though a sieve tray if the Froude-number, Fr, exceeds a critical value. From this condition follows: At small hole diameters (up to approximately 2 or 3 mm, the uniform gas flow through all the holes is the limiting mechanism: the minimum gas load decreases with increasing the hole diameter. At hole diameter grater than 2 or 3 mm, weeping of liquid through the tray becomes the decisive factor: the minimum gas load increases with increasing hole diameter.
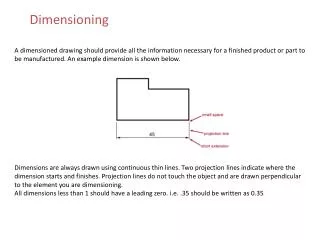
tray Dc lw Ad Ad Aac tray ll downcomer downcomer H hf hw hcl hL Inlet weir tray clear liquid Maximum Liquid Load Liquid flows down the column through the downcomers due to gravity. The limited driving force permits a limited liquid flow rate VL only. The following four empirical rules are often used to determine the maximum liquid flow rate (Hoppe and Mittelstrass): 1. The weir load VL/lw (where lw is the weir length) should not be less than 60m3/(m h) 2. The liquid velocity in the downcomer should not exceed a value of 0.1 m/s 3. The volume of the downcomer should permit a liquid residence time of more than 5 s. 4. The height of the clear liquid, hcl, in the downcomer should not exceed half of the tray spacing
Where a is the discharge coefficient that is approximately 0.61 ( I-10) ( I-11) ( I-12) cont. Maximum Liquid Load The flow of liquid through the downcomer is, in essence, comparable with the flow of a liquid trough the opening of a vessel. This classical flow problem has been solved by Torricelli early in 1644. Torricelli’s equation is: To apply this equation to the dowcomer situation, other phenomena must be taken into account: 1. The downcomer does not contain clear liquid but a liquid gas mixture with a relative liquid content of eLd. 2. The velocity of clear liquid in the downcomer exit is expressed by: 3. The density of the gas, rG, must not be neglected against the density of the liquid, rL 4. The liquid flows onto a tray with a clear liquid height hL. 5. Between downcomer inlet and downcomer outlet exists a pressure difference due to the pressure loss Dp of a tray. It can be expressed in terms of clear liquid height that is defined by:
tray downcomer ( I-13) H hf hw hcl hL The parameter eLd is unkown. For most of the systems (non-foaming) a value of 0.4 can be used. cont. Maximum Liquid Load Considering all these phenomena, the Torricelli’s equation turns into (Stichlmair):
tray Dc lw Ad Ad Aac tray ll downcomer H hf hw hcl (I-14) hL Minimum Liquid Load A column tray can, in principle, be operated even with very small liquid loads becasue the height of the two-phase layer on the tray is kept at a minimum value by the exit weir. However at extremely low liquid loads, liquid flows unevenly across the tray (maldistribution), which decreases the mass transfer efficiency. Accordingly, the minimum height of the weir overflow is usually set at approximately 5 mm; this corresponds to a minimum liquid weir load of:
VG/Aac Froth height entrainment downcomer capacity weeping minimum crest over weir Operating region VL/Aac Operating region of tray columns The operating region of a tray column can be represented in a diagram with x-coordinate VL and y-coordinate VG. Often these two loads are referred to the Active area (Aac) The upper borders for the gas for gas and liquid flow are absolute borders that can never be crossed. The lower borders (dashed lines), however, may be exceeded to a certain extent without encountering any flow problems. However the mass transfer efficiency my gradually decrease The shape and size of the operating region depends on the design parameters. An example is the relative free area, f, that affects the upper and lower borders of the operating region.
PART II: Two Phase Flow in Tray Columns • Flow regimes • Relative liquid holdup • Froth height • Liquid entrainment • Interfacial area • Pressure drop
Flow regimes After determination of the operating region of the column, the characteristic data on the two-phase flow on the tray must be studied to ensure safe column operation. The behavior and properties of the two-phase layer on trays are important for the effectiveness of tray columns. The different regimes are: • Buble regime: the liquid forms a continuous phase. The gas is in form of discrete bubbles in the liquid. • Drop regime: The gas forms continuous phase and the liquid is dispersed into fine droplets. • Froth regime: This regime represents the intermediate state between the bubble and the drop regime. No clearly dispersed phase exists.
tray ( II-1) downcomer H hf hw hcl hL ( II-2) Relative liquid holdup, eL This is a very important characteristic parameter of the two-phase layer on a tray. It is defined as the ratio of clear liquid height and froth height: From hf and eL, the height of clear liquid can be calculated. Equation II-2 is valid only when the term... ...is larger than 50.
tray downcomer H hf hw hcl hL Froth height, hf A knowledge of the froth height on a tray is very essential since it must be considerably lower than tray spacing, H. If the froth extends up to next tray it may block the openings in the tray and cause a sharp increase on pressure drop and, finally, flooding. The following correlation can be used (Stichlmair): ( II-3) The last term takes into account spraying of liquid, and therefore, it should be considered only when:
Liquid entrainment Gas flowing though the two-phase layer on a tray always entrains some liquid in form of fine droplets. This liquid entrainment is unfavorable because it affects the countercurrent flow of a gas and a liquid within the column and, in turn, decreases mass transfer efficiency of a tray. Even at very low gas loads (e.g bubble regime) fine droplets are formed by busting bubbles. At drop regime all the liquid of the tray is dispersed into fine droplets of different sizes. Liquid drops are entrained by the gas flow if their terminal velocity is lower than gas velocity. After having reached a certain height, most droplets fall down again into the two-phase layer on the tray. The smaller the drops the higher they rise. - The load Factor,F, is the dominant factor in the liquid entrainment phenomena. An increase of the gas load by a factor of 10 increases liquid entrainment by a factor of 1000 or 10000. - Another major factor is the surface tension becasue it influences the drop size. - Liquid viscosity is only of influence in high viscous systems. - The relative free area, f, and the tray spacing, H, have also an influence on the entrainment.
Liquid entrainment The correlation shown in the next diagram describes the major entrainment factors. Liquid entrainmetn is inevitable in tray operation. However, too large an entrainment affects mass transfer efficiency since a pure countercurrent flow of gas and liquid no longer exists. A rule of thumb says that an entrainment rate of up to 10% of the liquid flow onto the tray may be tolerated.
( II-4) ( II-5) Bubble regime Drop regime ( II-6) ( II-7) Interfacial area A high interfacial area in the two-phase layer on the tray is the most essential prerequisite for good mass transfer. The interfacial area, A, is usually referred to the volume of the froth, Vf, and expressed as: An estimation of the interfacial area order of magnitude is given by: This equation may be used in the drop and bubble regime, but not in the froth regime
( II-8) ( II-9) Pressure drop The basic equation for calculating the pressure drop of a tray is: The pressure drop in the clear liquid can be formulated: The last term of equation II-8 accounts for several residual factors including bubble formation, liquid mixing and vertical acceleration of the liquid. This term can be neglected in most cases.
( II-10) ( II-11) Pressure drop in the sieve tray, Dpd The pressure drop of a gas as it passes through a tray is given by: The discharge coefficient can be calculated by the following equation:
PART III: Mass Transfer in the two-phase layer on column trays • Definition of mass transfer efficiencies • Relationship between point annd tray efficiencies • Point efficiency • Tray efficiencies
Mass transfer efficiency The difficulty of a separation is given by the number of required equilibrium stages. When this number of stages is high, the separation is difficult. The number of equilibrium stages must be transformed into the real number of stages to get the real height required. This is because a tray is not working like the equilibrium stage. In most cases the concentration changes achieved by a tray are significantly smaller. To solve this problem, one uses the mass transfer efficiencies, defined as the ratio of the concentration changes of an actual tray and an equilibrium stage. Mass transfer efficiencies can be defined either as gas side efficiency EOG, by considering the concentration changes in the gas phase or as liquid side efficiency EOL by considering the concentration changes in the liquid phase. Two definitions of gas side mass transfer efficiencies have to be distinguished: • Point efficiency • Tray efficiency
( III-1) xi-1 Point efficiency can reach a maximum value of 1, when the mixing on the tray is perfect. Because practically this doesn’t happen, the point efficiency is only useful in a theoretical point of view. yi y x In practice, tray efficiency is more interesting. yi+1 xi Point efficiency The concentration change along an individual stream line of the gas flow is considered. The definition is: The subscript OG expresses that the overall resistance has been formally placed into the gas phase. The actual change in concentration of the gas (yi+1 , y) as it flows through the tray i is related to the maximum concentration change attainable, (yi+1 - y*(x)). y*(x) is the gas concentration in equilibrium with liquid concentration x at the point on the tray where the gas stream line passes through the two-phase layer.
xi-1 yi y x yi+1 xi Tray efficiency The tray efficiency, EMGi or Murphree efficiency, is defined as follows: ( III-2) Here the overall gas flow through the column is considered. The actual concentration change, (yi+1 - yi), is related to the maximum possible concentration change (yi+1 - y*(xi) ). Here y*(xi) is the gas concentration in equilibrium with liquid concentration xi going out from tray i. This definition is arbitrary because the gas concentration usually is different at each point on the tray. Thus, efficiencies higher than 100% may be obtained in some cases. Although the theoretical definition is unsatisfactory, it is of practical interest because it describes the separation efficiency of a real tray.
( III-3) ( III-4) Relationship between Point and Tray efficiency According to Lewis, when the liquid flows across the tray without mixing (“plug flow”), the two efficiencies are related by the following equation: The gas under each tray is assumed to be completely mixed. For complete liquid mixing, tray efficiency and point efficiency have the same value: The normal condition lies between the two extreme cases described by equations II-3 and III-4.
( III-5) ( III-6) ( III-7) Cont. Relationship between Point and Tray efficiency The degree of liquid mixing is expressed in terms of the Peclet number (Pe): That we can also express as: In which the eddy diffusion coefficient can be calculated: In plug-flow (no mixing) the value of Peclet-number becomes infinite: In the case of complete liquid mixing the value of Peclet-number is zero:
( III-8) ( III-9) Point efficiency calculation The prediction of the mass transfer efficiency is based on the following fundamental equation (Taylor and Krishna): The overall number of gas phase transfer units can be calculated from: Using expressions for the mass transfer coefficients, b, we obtain the next equation for the the point efficiency at froth regime: So NOG is a function j of the variables hf and uG, what agrees well with the experimental data.
( III-10) ( III-11) ( III-12) Practical determination of tray efficiency Usually empirical values of trays efficiencies are used and in most cases large safety factors are included to reduce the risk of malfunction of the separation column. Empirical tray efficiency data lie in the order of 70% for distillation systems under normal conditions. However, in absorption and desorption processes, values of tray efficiencies are reported to be as low as 1% or even 0.1%. In practice, empirical correlations are sometimes used for calculating the number of gas units and liquid side transfer units NG and NL, respectively: For sieve trays For bubble cap trays The correlations are dimensionally incorrect!!