Download
1 / 30
370 likes | 802 Views
Eukaryotic Chromosome Mapping. Using Genetic Recombination to Estimate Distances Between Genes. Linked Genes. F1: Red eyes, Beige body RrBb. Independent Assortment vs. Gene Linkage. Example from Drosophila Red eyes, x Pink eyes Beige body Ebony body

E N D
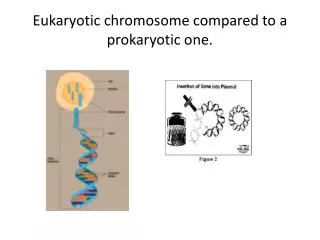
Eukaryotic Chromosome Mapping Using Genetic Recombination to Estimate Distances Between Genes
F1: Red eyes, Beige body RrBb Independent Assortment vs. Gene Linkage Example from Drosophila Red eyes, x Pink eyes Beige body Ebony body RRBB rrbb
Independent Assortment vs. Gene Linkage Testcross: cross to individual of known genotype F1:Red eyes X Pink eyes Beige body Ebony body RrBb rrbb
Independent Assortment vs. Gene Linkage F1:Red eyes X Pink eyes Beige body Ebony body RrBb rrbb RB Rb rb rB rb
R B r b r b R B F1: Red eyes, Beige body R B r b Independent Assortment vs. Gene Linkage If genes are linked: Red eyes, x Pink eyes Beige body Ebony body Coupling or Cis Configuration
R B r b X R B R b r b r B Independent Assortment vs. Gene Linkage F1: Red eyes, Beige body Four types of gametes are produced Parental Recombinant
Independent Assortment vs. Gene Linkage F1:Red eyes X Pink eyes Beige body Ebony body R B r b r b r b r B R B r b R b r b r b r b r b r b
Genetic Map Units 1% recombination = 1 map unit = 1 centimorgan These genes are located ___ map units apart on the same chromosome.
Limits of Genetic Mapping Genes that are 50 map units apart will appear to assort independently. The calculated distance between any TWO genes on the same chromosome should be less than 50 map units.
R b r B r B R b F1: Red eyes, Beige body R b r B Predicting Gamete Frequencies for Linked Genes Red eyes, x Pink eyes Ebony body Beige body Repulsion or Trans Configuration
F1: Red eyes Beige body R b r B Predicting Gamete Frequencies for Linked Genes The genes are 22 map units apart, therefore we expect 22% recombinant gametes and 78% parental gametes. 0.22 recombinants 0.78 parentals
Using a Three-point Testcross to Determine Genetic Distance • A cross between two parental strains is used to produce a tri-hybrid (heterozygous for three genes). • The tri-hybrid is crossed to an organism that is homozygous recessive for all three genes. • Eight classes of offspring are analyzed to determine recombination frequencies.
Problem 1, Page 2-1 In corn, a strain homozygous for the recessive alleles a (green), d (dwarf) and rg (normal leaves) was crossed to a strain homozygous for the dominant alleles of each of these genes, namely A (red), D (tall) and Rg (ragged leaves). Offspring of this cross were then crossed to plants that were green, dwarf and had normal leaves. The following phenotypic classes were observed.
red, tall, ragged 265 green, dwarf, normal 275 24 red, tall, normal 16 green, dwarf, ragged 90 red, dwarf, normal green, tall, ragged 70 red, dwarf, ragged 120 green, tall, normal 140 Problem 1, Page 2-1 Offspring Resulting from Three-Point Testcross
A D Rg a d rg X A D Rg a d rg A D Rg a d rg A D Rg a d rg Testcross X F2 a d rg a d rg Problem 1, Page 2-1 With Arbitrary Gene Order F1
A D Rg a d rg X F2 a d rg a d rg a d rg Parentals: A D Rg a d rg Recombinants: A d rg a D Rg A D rg a d Rg A d Rg a D rg Used as a genetic background to see the contribution from the tri-hybrid. Problem 1, Page 2-1With Arbitrary Gene Order
Problem 1, Page 2-1 • Determine which classes are parentals • The two parental classes will represent the largest number of offspring in the F2 generation. • Information on the parents may be given in the problem description itself.
Problem 1, Page 2-1 • Determine which classes are double recombinants • Double recombinants have two crossovers: one between the first and middle gene and one between the middle and third gene • These will be the two smallest classes. Double Recombinants: red, tall, normal green, dwarf, ragged
Problem 1, Page 2-1 • Determine the gene order • The middle gene is the one that changes places in the double recombinants when compared to the parental combinations.
Problem 1, Page 2-1 This shows why other gene orders are incorrect.
red, tall, ragged 265 green, dwarf, normal 275 24 red, tall, normal 16 green, dwarf, ragged 90 red, dwarf, normal green, tall, ragged 70 red, dwarf, ragged 120 green, tall, normal 140 • Assign genotypes to all classes • Use correct gene order Problem 1, Page 2-1 Contribution of F1 parent
Recombination between A and Rg Problem 1, Page 2-1 Single Crossovers Double Crossovers Recombination =
Recombination between Rg and D Problem 1, Page 2-1 Single Crossovers Double Crossovers Recombination =
Problem 1, Page 2-1 Two maps are possible:
Interference • Interference: crossover in one region inhibits crossover in an adjacent region • Interference = 1 – (coefficient of coincidence) • Coefficient of coincidence = Observed double crossovers Expected double crossovers
Calculating Interference • Coefficient of coincidence = Observed double crossovers = Expected double crossovers • Interference = 1–(coefficient of coincidence) =