Download
1 / 13
150 likes | 313 Views
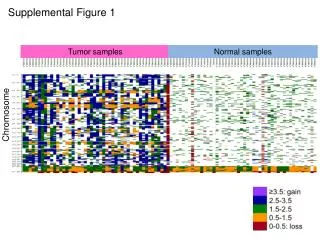
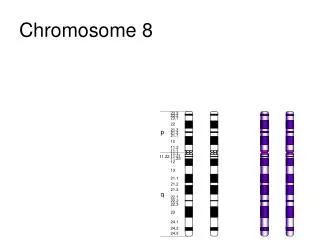
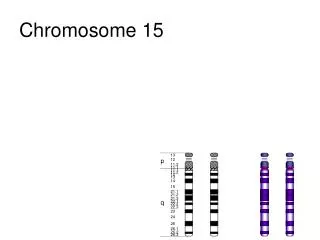
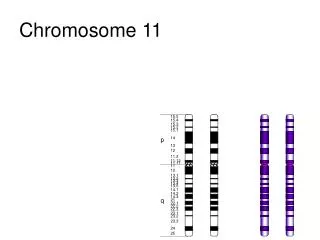
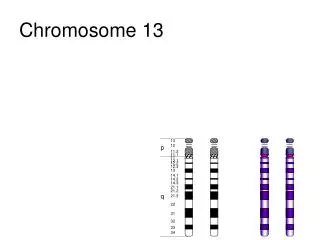
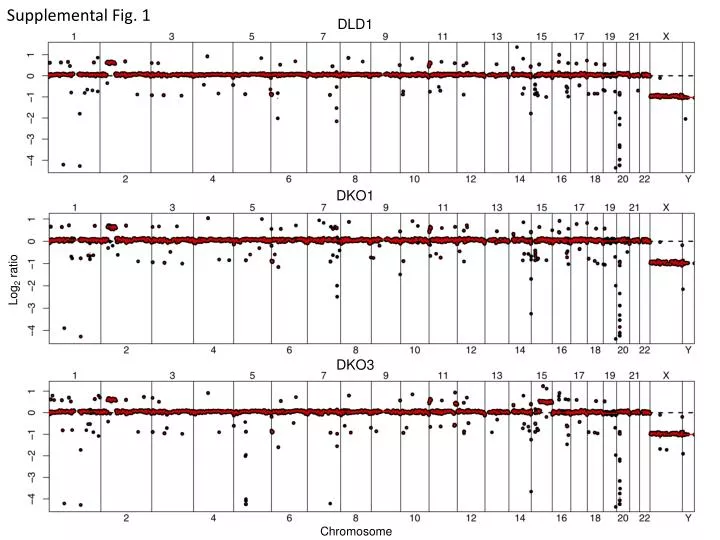
Supplemental Fig. 1. DLD1. DKO1. Log 2 ratio. DKO3. Chromosome. Hec1A. Hec1Aneo. Log 2 ratio. Hec1Adelmut59. Chromosome. Hec1Adelmut124. Hec1AdelWT34. Log 2 ratio. Hec1AdelWT277. Chromosome. 10% FBS. 0% FBS. 0%FBS+EGF. Supplemental Fig. 2. B. A. Mut/WT. Mut/WT. Mut/WT.

E N D
Supplemental Fig. 1 DLD1 DKO1 Log2 ratio DKO3 Chromosome
Hec1A Hec1Aneo Log2 ratio Hec1Adelmut59 Chromosome
Hec1Adelmut124 Hec1AdelWT34 Log2 ratio Hec1AdelWT277 Chromosome
10% FBS 0% FBS 0%FBS+EGF Supplemental Fig. 2 B A Mut/WT Mut/WT Mut/WT Mut/- Mut/- Mut/- -/WT -/WT -/WT P-Akt Mean fluorescent intensity P-ERK P-EGFR NRasGTP b-actin 0%FBS +EGF 10% FBS 0% FBS 0%FBS+EGF C 10% FBS D 0%FBS G12D/WT G12D/WT G12D/WT WT/G13D WT/G13D WT/G13D G12D/- G12D/- G12D/- WT/WT WT/WT WT/WT -/WT -/WT -/WT pY1125 pY1125 pY1069 pY1069 SW48 Tot-EGFR HCT116 Tot-EGFR pY774 pY774 Tot-Cbl Tot-Cbl
Supplemental Fig. 3 -/Mut -/Mut -/Mut -/Mut WT/- WT/- WT/- WT/- - - - - + + + + Conditioned media - - - - + + + + EGF pEGFR y1125 Hec1A b-actin P-EGFR y1125 DLD1 b-actin
Supplemental Fig. 4 Hec1A HCT116 ERK1/2 ERK1/2 AKT AKT WT/Mut - /Mut
Supplemental Fig. 5A DLD1 No siRNA NTC KRas HCT116 % confluency Hec1A Time (hours)
Supplemental Fig. 5B No siRNA NTC siKRas No siRNA NTC KRas DLD1 % wound closure Hec1A 0 h Time (hours) 24 h
Supplemental Fig. 7 DUSP5 DUSP6 Relative expression mutKRas WT KRas mutKRas WT KRas ETV1 ETV5 Relative expression ND ND mutKRas WT KRas mutKRas WT KRas
NT5E IER3 Relative expression mutKRas WT KRas mutKRas WT KRas UPP1 Relative expression mutKRas WT KRas
Supplemental Fig. 8 A B NT5E KRas Expression (normalized to NTC) Expression (normalized to NTC) C ETV1 Expression (normalized to NTC)
Supplemental Fig. 8 D E p=0.0006 1 p=0.026 p=0.227 H838 p=0.108 p=0.63 p=0.18 1 1.2 H661 1 1.2 H1299 1.0 RKO 1.0 HT55 0.8 H1568 0.8 A427 Viability (Target gene:NTC) Viability (Target gene:NTC) 0.6 A549 0.6 HupT3 0.4 0.4 H358 MiaPaca 0.2 0.2 0 0 KRas WT mut WT mut WT mut KRas WT mut WT mut WT mut siRNA KRas NT5E ETV1 siRNA KRas NT5E ETV1