Download
1 / 23
591 likes | 2k Views
Genetic Linkage and Chromosome Mapping. Genetics Spring 2014. Outline. Linkage and Recombination of Genes in a Chromosome.

E N D
Genetic Linkage and Chromosome Mapping Genetics Spring 2014
Linkage and Recombination of Genes in a Chromosome Independent assortment can be tested via testcross: if the genes are unlinked, then the four possible gametes are produced in equal proportion (recall Morgan experiments). Double heterozygous parent and the percentage of recombination is 50%
However, if genes are linked such as w and m in Drosophila X: female determinants Autosomes: Male determinants Y: not male determinants but sperm maturation XX: Female XY: Male XO: Sterile male
Then, the 4 possible gametes are NOT produced in equal proportion Should you only have two types of gametes instead of four? and the percentage of recombination less than 50%
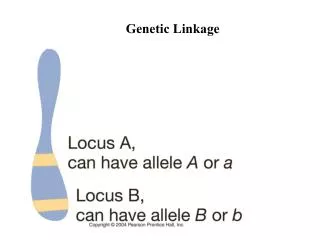
The nomenclature for linked genes differs from the one for unlinked genes and is ………… wm+/wm+x w+m/Y ww m+m+xw+m Y w w m+ + In addition, syntenic genes exist in either a trans (repulsive) or cis (coupling) configuration. w w m+ +
Let’s practice Cross between a female with white eyes and miniature wings and a male with red eyes and normal wings (P generation). P F1 The frequency of recombination varies among each pair of linked genes. F2
The Chi-square can be used to test linkage with the null hypothesis is NO linkage, therefore if linkage exists then the null hypothesis needs to be rejected (p-values < 0.05). Hypothesis r = 0.5 Result r = 0.377 Are w and m really linked? Note that syntenic genes (expressed on the same chromosome) can be unlinked
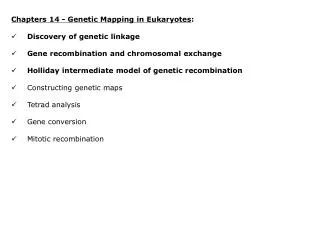
Genetic Mapping - Overview Genetic Map: Diagram of the linear order of genes (linkage map, chromosome map). Genetic Map: Reflects crossing-over during meiosis between nonsister chromatids. Distance between two genes can be represented four ways: Frequency of recombination Percent recombination Map distance in map units Map distance in centimorgans (cM) Alström syndrome is a rare autosomal recessive disorder characterized by pigmentary retinal degeneration, sensorineural hearing loss, childhood obesity, non-insulin-dependent diabetes mellitus, hyperlipidemia and chronic nephropathy
Genetic Mapping – Map Distance and frequency of Recombination Physically, a map unit can be defined as the length of the chromosome in which, on average, one cross-over is formed in every 50 cells undergoing meiosis.
If crossing over happens outside of the region between two genes, then recombination can not be assessed with the markers of interest (A and B) and the four gametes will be non-recombinant. If two crossing over events happens between the markers genes (A and B), and both involve the same chromatids pair, then neither crossing over is detected because all of the resulting four gametes will be non-recombinant.
Genetic Mapping – Multiple crossing over • The result of double crossovers in the interval between two genes is indistinguishable from independent assortment of the genes, provided that the chromatids participate at random in the exchanges. • Chromatid interference is the non-random choice of chromatids in successive crossovers. • Double crossovers can be detected in three-point crosses. Interference
Interference equals 1: No double cross-over (one CO blocks CO in adjacent region) BUT not the case as we have seen, thus underestimation of physical distance. • A mapping function is the relation between genetic map distance across an interval and the observed frequency of recombination across the interval. • A mapping function corrects for the loss of detectable recombinants due to multiple crossovers. • chromosome interference occurs when crossing-over reduces the probability of a second crossover nearby.
Recombination frequency How much recombination is observed Map unit How much crossing over between genes • This distinction is very important when looking at genes separated by a larger distance. • For short distance, one map unit equals 1 percent recombination, thus map distances are additive over short distances for creating genetic maps. • For map distances of 6.2 cM between genes rb and cv and 7.5 cM between rb and y, only maps B and C are possible. • Because the next experiment shows recombination between y to cv is 1.3% (not 13%), then only map B is possible.
Which of these two maps is correct? Each set of syntenic genes constitutes a linkage group and the number of linkage groups is the same as the haploid number of chromosomes for that species.
Genetic Mapping and the Three-Point Testcross A two-strand double crossover that spans the middle pair of alleles in a triple hetero zygote results in a reciprocal exchange of the middle pair of alleles between the two participating chromatids. Looking at the linked genes in corn: • lz: lazy or prostrate growth • gl: glossy leaf • su: sugary endosperm A cross is done using multiply heterozygous parental genotype: Homozygous recessive (usually not written) x
In a genetic cross involving linked genes, the two most frequent types of gametes with respect to any pair of genes are nonrecombinant (parental). • The rarest type of progeny must result from double crossover (that gene is in the middle) • The two reciprocal products that result from any crossover or combination of crossovers are expected to appear in approximately equal frequencies among progeny. This means that if the parental chromosomes are: And the double-crossover chromosomes are: Then Su and su are interchanged by the double crossing over and must be the middle pair of alleles. Therefore the genotype of the heterozygous parent in the cross should be written:
Progeny show recombination: rarest type had a double crossover; therefore Su is in middle: reorder the data: Lz Su Gllz____________su________________gl lz su gl 10.7 14.7 Recombination in region between Lz-Su = 40 + 33 + 4 + 2 = 79/740 = 10.7% between Su and Gl = 59 + 44 + 4 + 2 = 109/740 = 14.7%
lz gl su 10.7 map units 14.7 map units
Special features of Recombination Recombination is lower in heterochromatin (compact) than ineuchromatin Here, heterochromatin accounts for 2.8% of the total map length but is ~25% of the physical length. Chromosome 2 in Drosophila in metaphase
Genetic Mapping in Human Pedigree • DNA polymorphisms are genetic markers that can be used to map the risk of disease; precise physical locations (human maps have >5000 markers spaced every 500,000 bp) • If a disease trait and a particular molecular marker (RFLP, PCR band on gel) are NOT linked, then observe independent assortment of the trait and marker in progeny. • If disease trait and marker are very close together, linked, then they mostly stay together. • Use the rare recombinant progeny to map % recombination, map distance, and physical positions on particular chromosomes. The LOD score compares the likelihood of obtaining the test data if the two loci are indeed linked, to the likelihood of observing the same data purely by chance. Positive LOD scores favor the presence of linkage, whereas negative LOD scores indicate that linkage is less likely. LOD >3 linkage (1000:1 odds in favor of linkage) LOD <-2 excludes linkage
The 2′,5′-oligoadenylate synthetase genes (OAS1, OAS2, OAS3) that are located on human chromosome 12q24 encode a family of enzymes pivotal in innate anti-viral defense. OAS1 has a major function in the total constitutive activity of OAS enzymes. The first reported association of type I diabetes (T1D) with the OAS1 locus was with the single-nucleotide polymorphism (SNP) rs10774671. To further assess association of OAS1 SNPs with T1D, the Type I Diabetes Genetics Consortium (T1DGC) genotyped 11 tag SNPs. The 11 SNPs span about 41 kb from the 5′ to 3′ flanking region of the OAS1 gene and capture 95.9% of the available HapMap. Two-point LOD scores for linkage with various recombination fraction