Download
1 / 45
450 likes | 598 Views
Forecasting the risk of malaria epidemics using climate prediction models. Tim Palmer ECMWF. Weather/Climate Prediction. Weather (1-10 days) Seasonal to Decadal ( 6 months-10 years) Climate change (10-100 years). El-Niño. Global impact of El-Niño. The thermohaline circulation.

E N D
Forecasting the risk of malaria epidemics using climate prediction models Tim Palmer ECMWF
Weather/Climate Prediction • Weather (1-10 days) • Seasonal to Decadal ( 6 months-10 years) • Climate change (10-100 years)
Numerical Models of Weather and Climate • Weather – atmosphere • Seasonal – atmosphere-ocean • Climate – Earth System
“… one flap of a sea-gull’s wing may forever change the future course of the weather” (Lorenz, 1965)
Lorenz (1963): prototype model of chaos In a nonlinear dynamical system, the finite-time growth of initial uncertainties is flow dependent. Scientific basis for ensemble forecasting October 1987!
Ensemble Forecasting in Weather Prediction ………… 49 4 3 2 1 50 Perturb initial conditions consistent with uncertainty in observations 0 Forecast Probability of Temp or Precip…
MLSP 66-hour forecasts, VT: 16-Oct-1987, 6 UTC TL399 EPS with TL95, moist SVs
Representing model uncertainty • Multi-model ensembles • Perturbed parameter ensembles • Stochastic physics ensembles
Development of a European Multi-Model Ensemble System for Seasonal to Interannual Climate Prediction
• 7 global coupled ocean-atmosphere climate models DEMETER Multi-model ensemble system 9 member ensembles ERA-40 initial conditions SST and wind perturbations 4 start dates per year 6 months hindcasts •Hindcast production for: 1980-2001
Multi-Model Ensemble Climate Forecast System CLIMATE MODEL B CLIMATE MODEL A CLIMATE MODEL G 1 2 3 4 2 3 4 2 3 1 1 5 6 7 8 9 5 6 7 8 9 4 5 6 7 8 9 … Forecast Probability of Temp or Precip…
Predicting El Niño ECMWF model only DEMETER multi-model ensemble Palmer et al, 2004; Hagedorn et al 2005
Models IPCC (AR4) multi-model multi-scenario ensemble- seasonal mean near-surface temperature -
Probability of seasonal temperature above 95% ile. associated with global warming
Probability of seasonal precipitation below 5% ile. associated with global warming
DEMETER End-to-end Forecast System Seasonal forecast ………… 62 4 3 2 1 63 ………… Downscaling 63 62 4 3 2 1 Application model ………… 2 1 63 62 4 3 non-linear transformation 0 0 Probability of Crop Yield/ Malaria Incidence Probability of Precip & Temp…
DEMETER and Malaria • A forecast quality assessment of an end-to-end probabilistic multi-model seasonal forecast system using a malaria model. . A. P. Morse, F.-J. Doblas-Reyes, Moshe B. Hoshen, R. Hagedorn, T.N.Palmer. Tellus, 57a, 464-498 • Malaria early warnings based on seasonal climate forecasts from multi-model ensembles. M.C. Thomson, F.J.Doblas-Reyes, S.J.Mason, R.Hagedorn, S.J.Connor, T.Phindela, A.P.Morse and T.N.Palmer. Nature to appear Special issue of Tellus (vol 57a number 3) devoted to DEMETER
Thomson, M.C., S.J.Connor, T.Phindela, and S.Mason: Rainfall and sea surface temperature monitoring for malaria early warning in Botswana. Am.J.Trop.Med.Hyg., 73, 214-221 (2005)
Areas with epidemic malaria Precipitation composites for the five years with the highest (top row) and lowest (bottom row) standardised malaria incidence for DEMETER (left) and CMAP (right)
DEMETER-based PDFs of malaria incidence for Botswana (forecasts made 5 months in advance of epidemic) 5 years with highest observed malaria incidence 5 years with lowest observed malaria incidence
-- high malaria years -- low malaria years Low malaria incidence High malaria incidence Cumulative PDFs of standardised malaria incidence in Botswana five months in advance of the epidemic
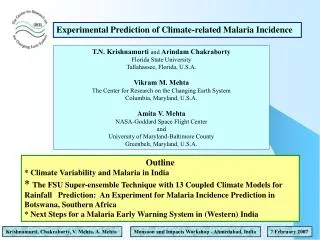
Overview of Liverpool Malaria Model 10 day rainfall Mosquito population Daily temperature Malaria transmission -mosquito Daily temperature Daily temperature Humidity (10 day rainfall) Daily Malaria incidence(number of new cases) and prevalence (proportion of population infected) Malaria transmission - human Hoshen and Morse, 2004 Malaria Journal 3(32)
Malaria Transmission Model simplified schematic of Liverpool model Uninfected Infected Infectious death death death Maturing larvae Uninfected Infected Infectious (Sporogonic cycle) Mosquito Infection Infection Human Recovery • Underlying model is similar to that described by Aron and May (1982) • Model assumes no immunity, no superinfection
Malaria Transmission Model • where • x1 = proportion infected humans • x2 = proportion infectious humans • y1 = proportion infected mosquitoes • y2 = proportion infectious mosquitoes • a = human biting rate of mosquito • b = human susceptibility to infection • c = mosquito susceptibility to infection • m = mosquito to human population ratio • r = human recovery rate • = mosquito mortality rate x = latent period in human y = latent period in mosquito (sporogonic cycle) and , indicate those variables at time t -
DEMETER: malaria prediction Verification DEMETER-MM:Ensemble-mean Terciles Time series for grid point in South Africa (17.5 S, 25.0 E) Morse et al, 2005
http://www.ecmwf.int/research/demeter DEMETER data can be freely downloaded
Meningococcal (epidemic) meningitis – land erosionNeisseria meningitidis • Transmission of N.meningitidis is by direct droplet contact • 20-40% of the population in West Africa are symptomless carriers • Meningococcal meningitis occurs when the bacteria penetrate the mucous membrame • Changes in the proportion of clinical to subclinical infections rather than the risk of infection are thought to explain changes in the incidence of disease
The spatial distribution of epidemics Affected districts (n = 1232 / 3281) Reported to district Reported to province Molesworth, A.M. Thomson, M.C. Connor, S.J. Cresswell, M.C. Morse, AP. Shears, P. Hart, C.A. Cuevas, L.E. (2002). Where is the Meningitis Belt? Transactions of the Royal Society of Tropical Medicine and Hygiene 96, 242-249
Potential for predicting dust using Sea Surface Temperatures SST anomaly pattern associated with dustiest years in Niger Ben Mohamed and Neil Ward Dustiest years inferred from visibility data are 1974, 1983, 1985, 1988, 1991, 1994
Cholera and climate Lagged correlation between SSTs and cholera in Dhaka, Bangla Desh (data from International Centre for Diarrhoeal Disease Control) over 1980-2002 From X. Rodo (Univ. of Barcelona)
Conclusions • Climate models are sufficiently realistic that reliable predictions of temperature and rainfall are possible on weather and climate timescales • Uncertainties in prediction are associated with sensitivity to initial conditions and model formulation. The effect of these uncertainties can be represented using ensemble prediction techniques • Application models can be coupled to climate models allowing probabilistic predictions of user-relevant variables; weather/climate variables are intermediate • Health-based applications include studies of epidemic malaria in Africa – there is the potential for other quantitative health-based applications.