Download

1 / 144
1.49k likes | 1.79k Views
Forecasting using simple models. Outline. Basic forecasting models The basic ideas behind each model When each model may be appropriate Illustrate with examples Forecast error measures Automatic model selection Adaptive smoothing methods (automatic alpha adaptation)

E N D
Outline • Basic forecasting models • The basic ideas behind each model • When each model may be appropriate • Illustrate with examples • Forecast error measures • Automatic model selection • Adaptive smoothing methods • (automatic alpha adaptation) • Ideas in model based forecasting techniques • Regression • Autocorrelation • Prediction intervals
Basic Forecasting Models • Moving average and weighted moving average • First order exponential smoothing • Second order exponential smoothing • First order exponential smoothing with trends and/or seasonal patterns • Croston’s method
M-Period Moving Average • i.e. the average of the last M data points • Basically assumes a stable (trend free) series • How should we choose M? • Advantages of large M? • Advantages of large M? • Average age of data = M/2
Weighted Moving Averages • The Wi are weights attached to each historical data point • Essentially all known (univariate) forecasting schemes are weighted moving averages • Thus, don’t screw around with the general versions unless you are an expert
Simple Exponential Smoothing • Pt+1(t) = Forecast for time t+1 made at time t • Vt = Actual outcome at time t • 0<<1 is the “smoothing parameter”
Two Views of Same Equation • Pt+1(t) = Pt(t-1) + [Vt – Pt(t-1)] • Adjust forecast based on last forecast error OR • Pt+1(t) = (1- )Pt(t-1) + Vt • Weighted average of last forecast and last Actual
Simple Exponential Smoothing • Is appropriate when the underlying time series behaves like a constant + Noise • Xt = + Nt • Or when the mean is wandering around • That is, for a quite stable process • Not appropriate when trends or seasonality present
Simple Exponential Smoothing • We can show by recursive substitution that ES can also be written as: • Pt+1(t) = Vt + (1-)Vt-1 + (1-)2Vt-2 + (1-)3Vt-3 +….. • Is a weighted average of past observations • Weights decay geometrically as we go backwards in time
Simple Exponential Smoothing • Ft+1(t) = At + (1-)At-1 + (1-)2At-2 + (1-)3At-3 +….. • Large adjusts more quickly to changes • Smaller provides more “averaging” and thus lower variance when things are stable • Exponential smoothing is intuitively more appealing than moving averages
Automatic selection of • Using historical data • Apply a range of values • For each, calculate the error in one-step-ahead forecasts • e.g. the root mean squared error (RMSE) • Select the that minimizes RMSE
RMSE vs Alpha 1.45 1.4 1.35 RMSE 1.3 1.25 1.2 1.15 0 0.1 0.2 0.3 0.4 0.5 0.6 0.7 0.8 0.9 1 Alpha
Recommended Alpha • Typically alpha should be in the range 0.05 to 0.3 • If RMSE analysis indicates larger alpha, exponential smoothing may not be appropriate
Series and Forecast using Alpha=0.9 2 1.5 1 Forecast 0.5 0 -0.5 1 2 3 4 5 6 7 8 9 10 11 12 13 14 15 16 Period
Forecast RMSE vs Alpha 0.67 0.66 0.65 0.64 0.63 Forecast RMSE 0.62 Series1 0.61 0.6 0.59 0.58 0.57 0 0.2 0.4 0.6 0.8 1 Alpha
Forecast RMSE vs Alpha for Lake Huron Data 1.1 1.05 1 0.95 0.9 RMSE 0.85 0.8 0.75 0.7 0.65 0.6 0 0.1 0.2 0.3 0.4 0.5 0.6 0.7 0.8 0.9 1 Alpha
Forecast RMSE vs Alpha for Monthly Furniture Demand Data 45.6 40.6 35.6 30.6 25.6 RMSE 20.6 15.6 10.6 5.6 0.6 0 0.1 0.2 0.3 0.4 0.5 0.6 0.7 0.8 0.9 1 Alpha
Exponential smoothing will lag behind a trend • Suppose Xt=b0+ b1t • And St= (1- )St-1 + Xt • Can show that
Double Exponential Smoothing • Modifies exponential smoothing for following a linear trend • i.e. Smooth the smoothed value
St Lags St[2] Lags even more
6 5 4 Double Over-shoots a change (must “re-learn” the slope) 3 Trend 2 Series Data Single Smoothing Double smoothing 1 0 -1 1 6 11 16 21 26 31 36 41 46 51 56 61 66 71 76 81 86 91 96 101
Holt-Winters Trend and Seasonal Methods • “Exponential smoothing for data with trend and/or seasonality” • Two models, Multiplicative and Additive • Models contain estimates of trend and seasonal components • Models “smooth”, i.e. place greater weight on more recent data
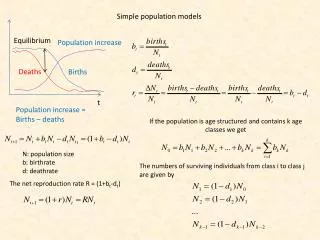
Winters Multiplicative Model • Xt = (b1+b2t)ct + t • Where ct are seasonal terms and • Note that the amplitude depends on the level of the series • Once we start smoothing, the seasonal components may not add to L
Holt-Winters Trend Model • Xt = (b1+b2t) + t • Same except no seasonal effect • Works the same as the trend + season model except simpler