Download
1 / 31
310 likes | 615 Views
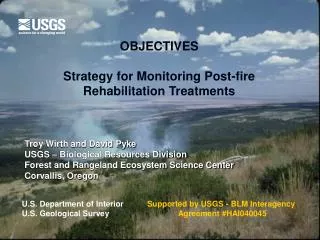
STRATIFICATION PLOT PLACEMENT CONTROLS Strategy for Monitoring Post-fire Rehabilitation Treatments. Troy Wirth and David Pyke USGS – Biological Resources Division Forest and Rangeland Ecosystem Science Center Corvallis, Oregon. U.S. Department of Interior U.S. Geological Survey.

E N D
STRATIFICATIONPLOT PLACEMENTCONTROLSStrategy for Monitoring Post-fire Rehabilitation Treatments Troy Wirth and David Pyke USGS – Biological Resources Division Forest and Rangeland Ecosystem Science Center Corvallis, Oregon U.S. Department of Interior U.S. Geological Survey Supported by USGS - BLM Interagency Agreement #HAI040045
Monitoring Approach • Objectives • Stratification • Control Plots • Random Sampling • Data Quality • Statistical Analysis • Repeatable, objective field methods using Rangeland Monitoring Database
Stratification • Division of treatment areas into defined monitoring units with similar characteristics • Decreases variability, increases precision • Data collected is then inferred to be representative of the entire monitoring unit. • Stratification into monitoring units helps to determine success at the project level - and eventually at a regional scale
Stratification • Monitoring Units may vary across the landscape and be separated by other monitoring units. From Herrick et al 2005b
Stratification Background Information • Aerial photographs • Soil Surveys • Determine what mapping units cover the treatment area • Can you identify the soil series within the mapping units? • What ecological sites are within the mapping units? • How do you determine the ecological sites?
Stratification Background Information • GIS Layers • Digital Elevation Model (DEM’s) • Land management activities (grazing allotments, previous seedings and fires etc.) • Fire and treatment perimeters for current project • Soils • Roads, streams and other geographic features that would be avoided
Stratification Background Information - Resources • Web Soil Survey http://websoilsurvey.nrcs.usda.gov/app/ • Soil Data Mart http://soildatamart.nrcs.usda.gov/Default.aspx • USGS Seamless Data Distribution http://seamless.usgs.gov/ • Official Soil Series Descriptions http://soils.usda.gov/technical/classification/osd/index.html
Stratification Identifying Ecological Sites • Each plot must have Ecol. Site identified • Not all Monitoring Units are defined by one Ecol Site. • An ecological site is a “distinctive kind of land with specific characteristics that differs from other kinds of land in its ability to produce a distinctive kind and amount of vegetation” (NRCS). • Consist of site characteristics, plant communities, site interpretations, and supporting information • Identify ecological sites using soil and landform indicators (soil surveys)
Soil maps • Soils are grouped into soil mapping units because we often cannot map soils at the scale at which they occur • Soil map unit: includes one or more dominant soilmap unit components + inclusions (minor map unit components) • Soil map unit component: soil series + slope and surface texture modifier
A soil map unit can be: • An ASSOCIATION of two or more soils that occur in a repetitive and predictable pattern (e.g. low ridges & swales) • A COMPLEX of two or more soils that usually do not occur in a predictable pattern at a mappable scale (e.g. coarse and fine soils in a river floodplain) • A single soil series (but even these map units usually have “inclusions” too small to be mapped). Sometimes call a CONSOCIATION
Using soils to identify ecological sites • An ecological site can include more than one soil series, provided that the soils are similar • A soil map unit can include more than one ecological site. Soil map units often include many different soils, with different potentials to support plant communities • Even a soil seriescan include more than one ecological site. Soil surface texture often varies within a soil series. Soil surface texture is very important in distinguishing ecological sites.
Stratification Identifying Ecological Sites • Determine soil mapping unit • Examine soil mapping unit description (220) • Determine soil series within mapping unit.
Stratification Identifying Ecological Sites Ninemile and Carvix Soil Series Dig soil pits to identify soil series and associated ecological sites
Stratification Criteria • Treatment type • Soil type / ecological site • Slope / aspect / elevation • Multiple polygons/ minimum size • Each stratification criteria doubles number of monitoring units (if all are monitored) • What criteria will reduce variability the most?
Example StratificationTreatment perimeter with slope reclassification
Example Stratification Treatment perimeter with slopes < & > 15% slope
Example Stratification Soil mapping units within treatment perimeter
Example Stratification Sample Areas 121 Mcpan-Chijer complex 181 Starbuck- Mcpan-rock outcrop
Random Sampling • Enables statistical inference to the monitoring unit • GIS or traditional map grid • Can use several types of random sampling (simple, stratified, and two-stage random sampling) • Establish rejection criteria (slopes/roads/streams/rocks etc..)
Random Point GenerationHawth’s Tools Features • Input layer (polygon/raster) • Minimum distance between points • Stratified – (number of points) • Stratified design • Polygon unique id • Number of points per polygon • Density of points per polygon
Hawth’s Tools Main Screen • 1. Generate Random points • Use for determining random plot locations • Generate Regular points • Other uses including separating polygons into roughly equal sizes
Example Stratification (simple)Random point generation screen
Controls • Was rehabilitation necessary? • Plots that receive no treatment • No seed • No soil surface disturbance (affects bare ground and annual exotic abundance) • Randomly place within monitoring unit prior to treatment implementation • If controls are not possible, quantitative standards must be specified
Controls • Long-term monitoring – controls are highly valuable • May not be able to distinguish between seeded and unseeded plants • Help to determine persistence of seeding • Helps to determine treatment effect • Provides a measure of natural recovery