Download
1 / 1
10 likes | 126 Views
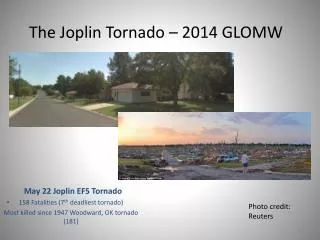
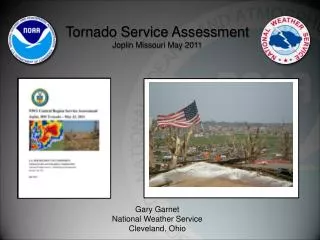
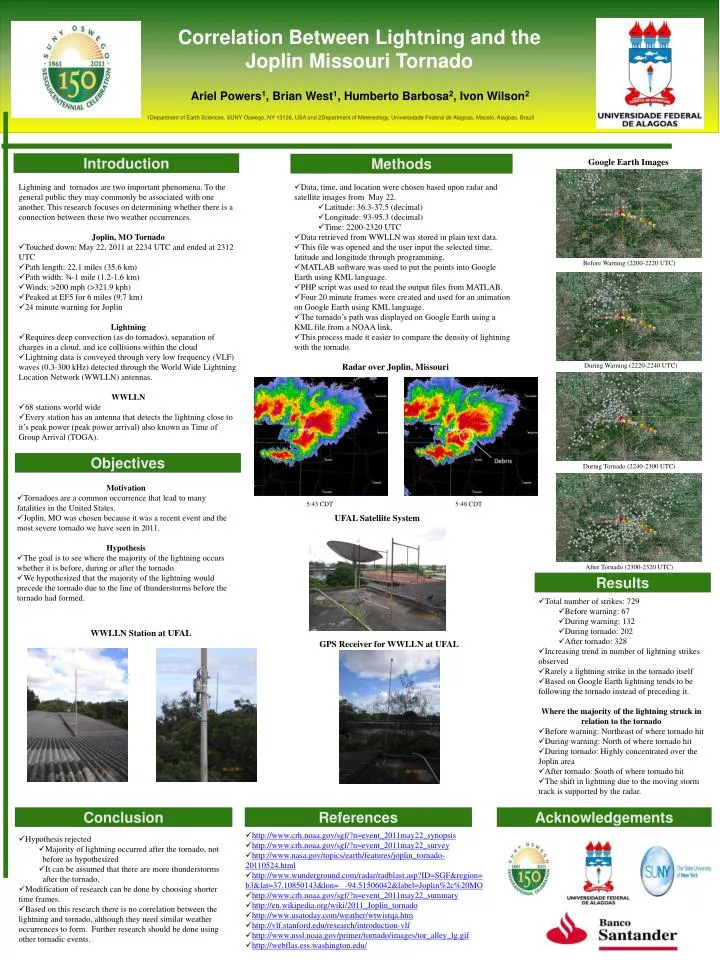
Correlation Between Lightning and the Joplin Missouri Tornado. Ariel Powers 1 , Brian West 1 , Humberto Barbosa 2 , Ivon Wilson 2 1 1Department of Earth Sciences, SUNY Oswego, NY 13126, USA and 2Department of Metereology, Universidade Federal de Alagoas, Maceio, Alagoas, Brazil. Introduction.

E N D
Correlation Between Lightning and the Joplin Missouri Tornado Ariel Powers1, Brian West1, Humberto Barbosa2, Ivon Wilson2 11Department of Earth Sciences, SUNY Oswego, NY 13126, USA and 2Department of Metereology, Universidade Federal de Alagoas, Maceio, Alagoas, Brazil Introduction Methods Google Earth Images • Lightning and tornados are two important phenomena. To the general public they may commonly be associated with one another. This research focuses on determining whether there is a connection between these two weather occurrences. • Joplin, MO Tornado • Touched down: May 22, 2011 at 2234 UTC and ended at 2312 UTC • Path length: 22.1 miles (35.6 km) • Path width: ¾-1 mile (1.2-1.6 km) • Winds: >200 mph (>321.9 kph) • Peaked at EF5 for 6 miles (9.7 km) • 24 minute warning for Joplin • Lightning • Requires deep convection (as do tornados), separation of charges in a cloud, and ice collisions within the cloud • Lightning data is conveyed through very low frequency (VLF) waves (0.3-300 kHz) detected through the World Wide Lightning Location Network (WWLLN) antennas. • WWLLN • 68 stations world wide • Every station has an antenna that detects the lightning close to it’s peak power (peak power arrival) also known as Time of Group Arrival (TOGA). • Data, time, and location were chosen based upon radar and satellite images from May 22. • Latitude: 36.3-37.5 (decimal) • Longitude: 93-95.3 (decimal) • Time: 2200-2320 UTC • Data retrieved from WWLLN was stored in plain text data. • This file was opened and the user input the selected time, latitude and longitude through programming. • MATLAB software was used to put the points into Google Earth using KML language. • PHP script was used to read the output files from MATLAB. • Four 20 minute frames were created and used for an animation on Google Earth using KML language. • The tornado’s path was displayed on Google Earth using a KML file from a NOAA link. • This process made it easier to compare the density of lightning with the tornado. Before Warning (2200-2220 UTC) Radar over Joplin, Missouri During Warning (2220-2240 UTC) Objectives During Tornado (2240-2300 UTC) • Motivation • Tornadoes are a common occurrence that lead to many fatalities in the United States. • Joplin, MO was chosen because it was a recent event and the most severe tornado we have seen in 2011. • Hypothesis • The goal is to see where the majority of the lightning occurs whether it is before, during or after the tornado. • We hypothesized that the majority of the lightning would precede the tornado due to the line of thunderstorms before the tornado had formed. 5:43 CDT 5:48 CDT UFAL Satellite System After Tornado (2300-2320 UTC) Results • Total number of strikes: 729 • Before warning: 67 • During warning: 132 • During tornado: 202 • After tornado: 328 • Increasing trend in number of lightning strikes observed • Rarely a lightning strike in the tornado itself • Based on Google Earth lightning tends to be following the tornado instead of preceding it. • Where the majority of the lightning struck in relation to the tornado • Before warning: Northeast of where tornado hit • During warning: North of where tornado hit • During tornado: Highly concentrated over the Joplin area • After tornado: South of where tornado hit • The shift in lightning due to the moving storm track is supported by the radar. WWLLN Station at UFAL GPS Receiver for WWLLN at UFAL Conclusion References Acknowledgements • http://www.crh.noaa.gov/sgf/?n=event_2011may22_synopsis • http://www.crh.noaa.gov/sgf/?n=event_2011may22_survey • http://www.nasa.gov/topics/earth/features/joplin_tornado-20110524.html • http://www.wunderground.com/radar/radblast.asp?ID=SGF®ion=b3&lat=37.10850143&lon= -94.51506042&label=Joplin%2c%20MO • http://www.crh.noaa.gov/sgf/?n=event_2011may22_summary • http://en.wikipedia.org/wiki/2011_Joplin_tornado • http://www.usatoday.com/weather/wtwistqa.htm • http://vlf.stanford.edu/research/introduction-vlf • http://www.nssl.noaa.gov/primer/tornado/images/tor_alley_lg.gif • http://webflas.ess.washington.edu/ • Hypothesis rejected • Majority of lightning occurred after the tornado, not before as hypothesized • It can be assumed that there are more thunderstorms after the tornado. • Modification of research can be done by choosing shorter time frames. • Based on this research there is no correlation between the lightning and tornado, although they need similar weather occurrences to form. Further research should be done using other tornadic events.